View database sessions and running SQL
When troubleshooting database slowdowns, blocking, or abnormal SQL, the first step is usually to inspect current sessions and running statements. NineData is suitable for database operations troubleshooting and helps teams view sessions, locate executing SQL, and analyze issues more efficiently.
Use View Sessions to discover currently running slow SQL and high-frequency SQL for database performance troubleshooting. It helps with these scenarios:
Trace long-running SQL: Sometimes some queries may run for a long time, occupying database resources and thus affecting overall performance. If there is no way to detect these queries, it is impossible to take timely measures to optimize them.
Discover blocking SQL: In a multi-user database environment, blocking issues may occur due to reasons such as locking or long-running queries. If there is no way to view the running processes, it will be impossible to accurately diagnose and solve these problems.
View current database connections of users and hosts: Obtain a list of all current active connections, including connection status, runtime, and other information, which helps to monitor database activity.
KILL problematic SQL processes: When problematic queries or processes are detected, use the end-session button to terminate them, release resources, and restore normal database operation. Select multiple processes to terminate them in batches.
Diagnose performance issues: If the database becomes slow, review sessions to check whether too many connections are waiting or running and identify the root cause.
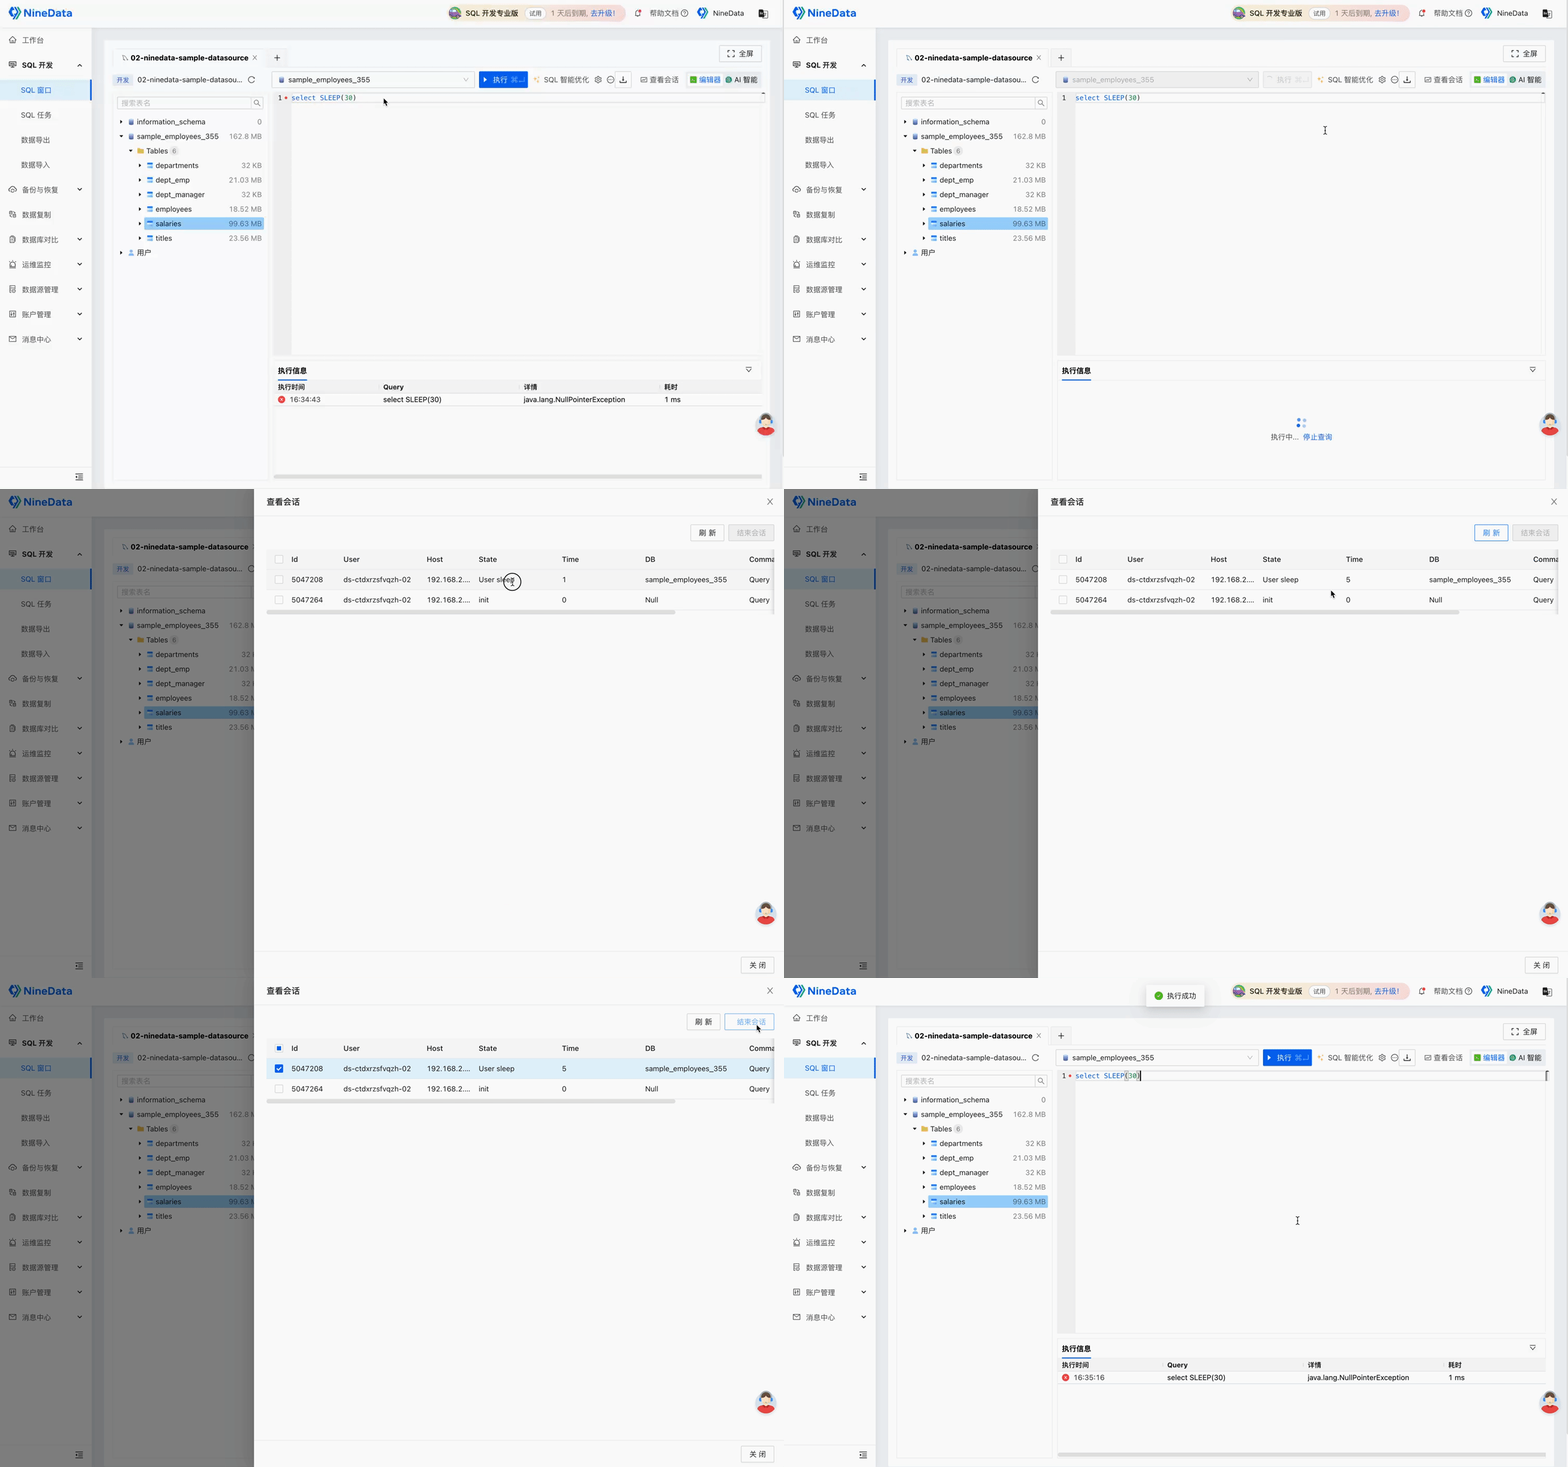
Using NineData to View SQL Currently Being Executed in the Database
In NineData, complete these operations from SQL Console by clicking View Sessions. For details, see the following animated image: