Analyze slow queries with NineData
Use NineData Slow Query Analysis to collect slow SQL, diagnose performance issues, review slow-query trends, and download reports for follow-up optimization. The feature helps DBAs and developers move from manual slow-log review to a centralized analysis workflow.
What Slow Query Analysis Provides
NineData helps teams:
- Collect and record slow queries from database instances.
- Group slow SQL by SQL template.
- Review execution time, query time, user, host, and related details.
- Diagnose slow SQL with indicators such as execution time, effective reads, wait ratio, and cache hit rate.
- Generate index recommendations based on the CBO cost model.
- Apply SQL development standards during slow SQL analysis.
- Use dashboards and downloadable reports for team follow-up.
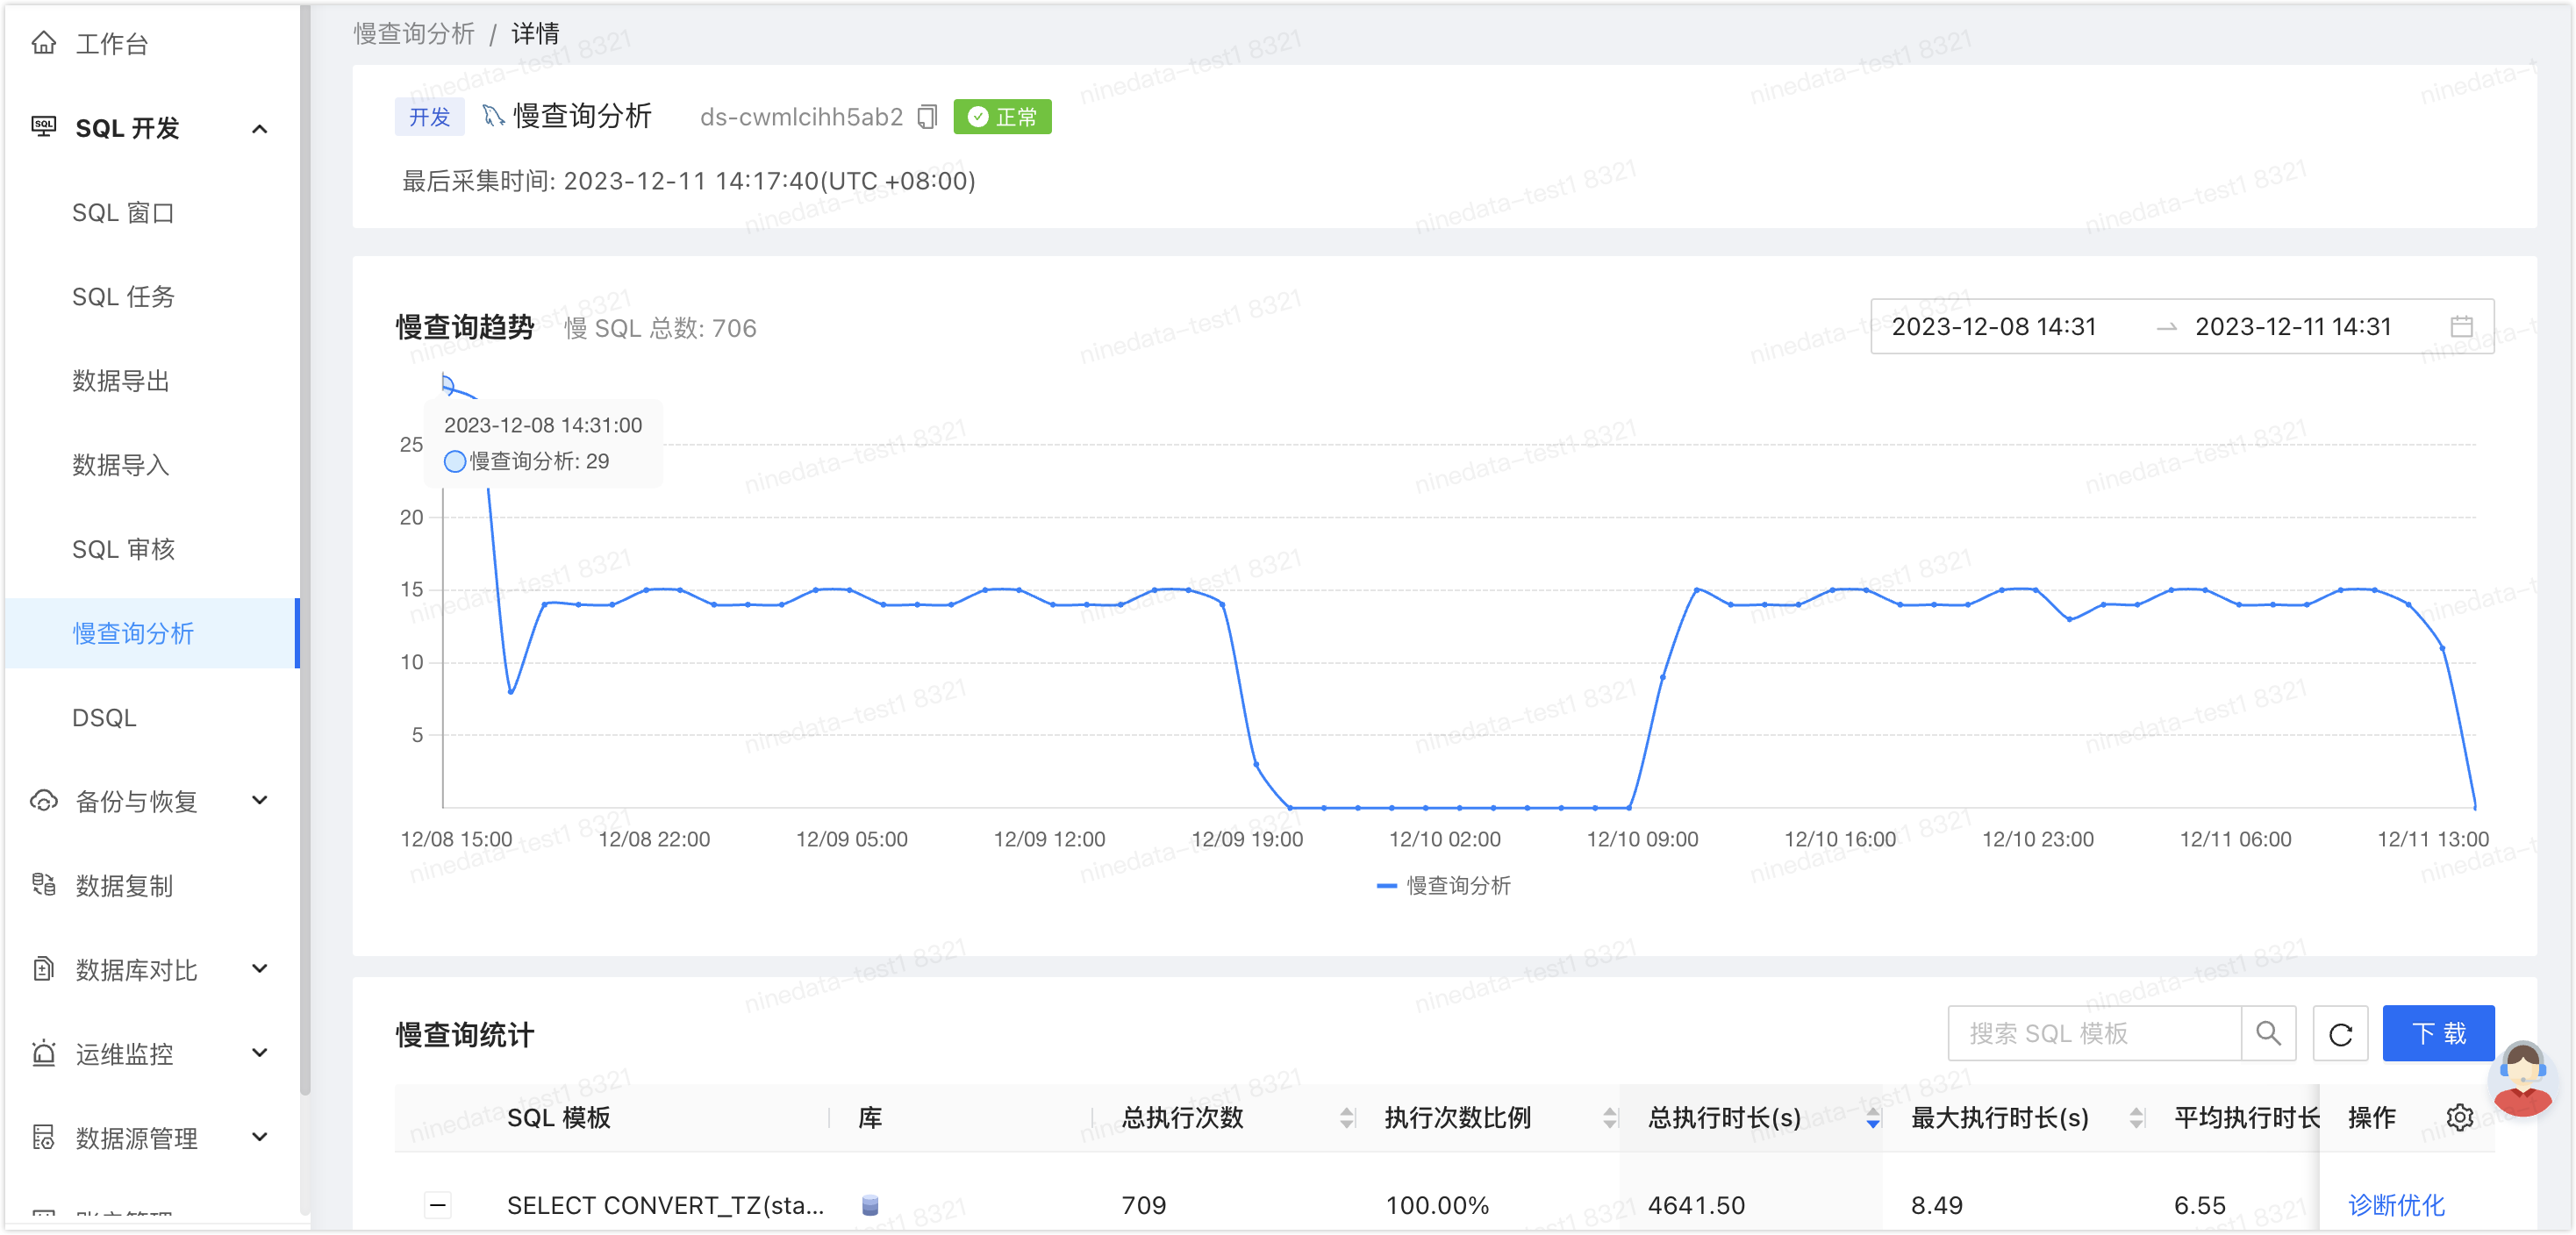
Review Slow Query Trends
Use the trend chart to review the total number of slow queries in a selected time range and identify abnormal days.
Review Slow Query Details
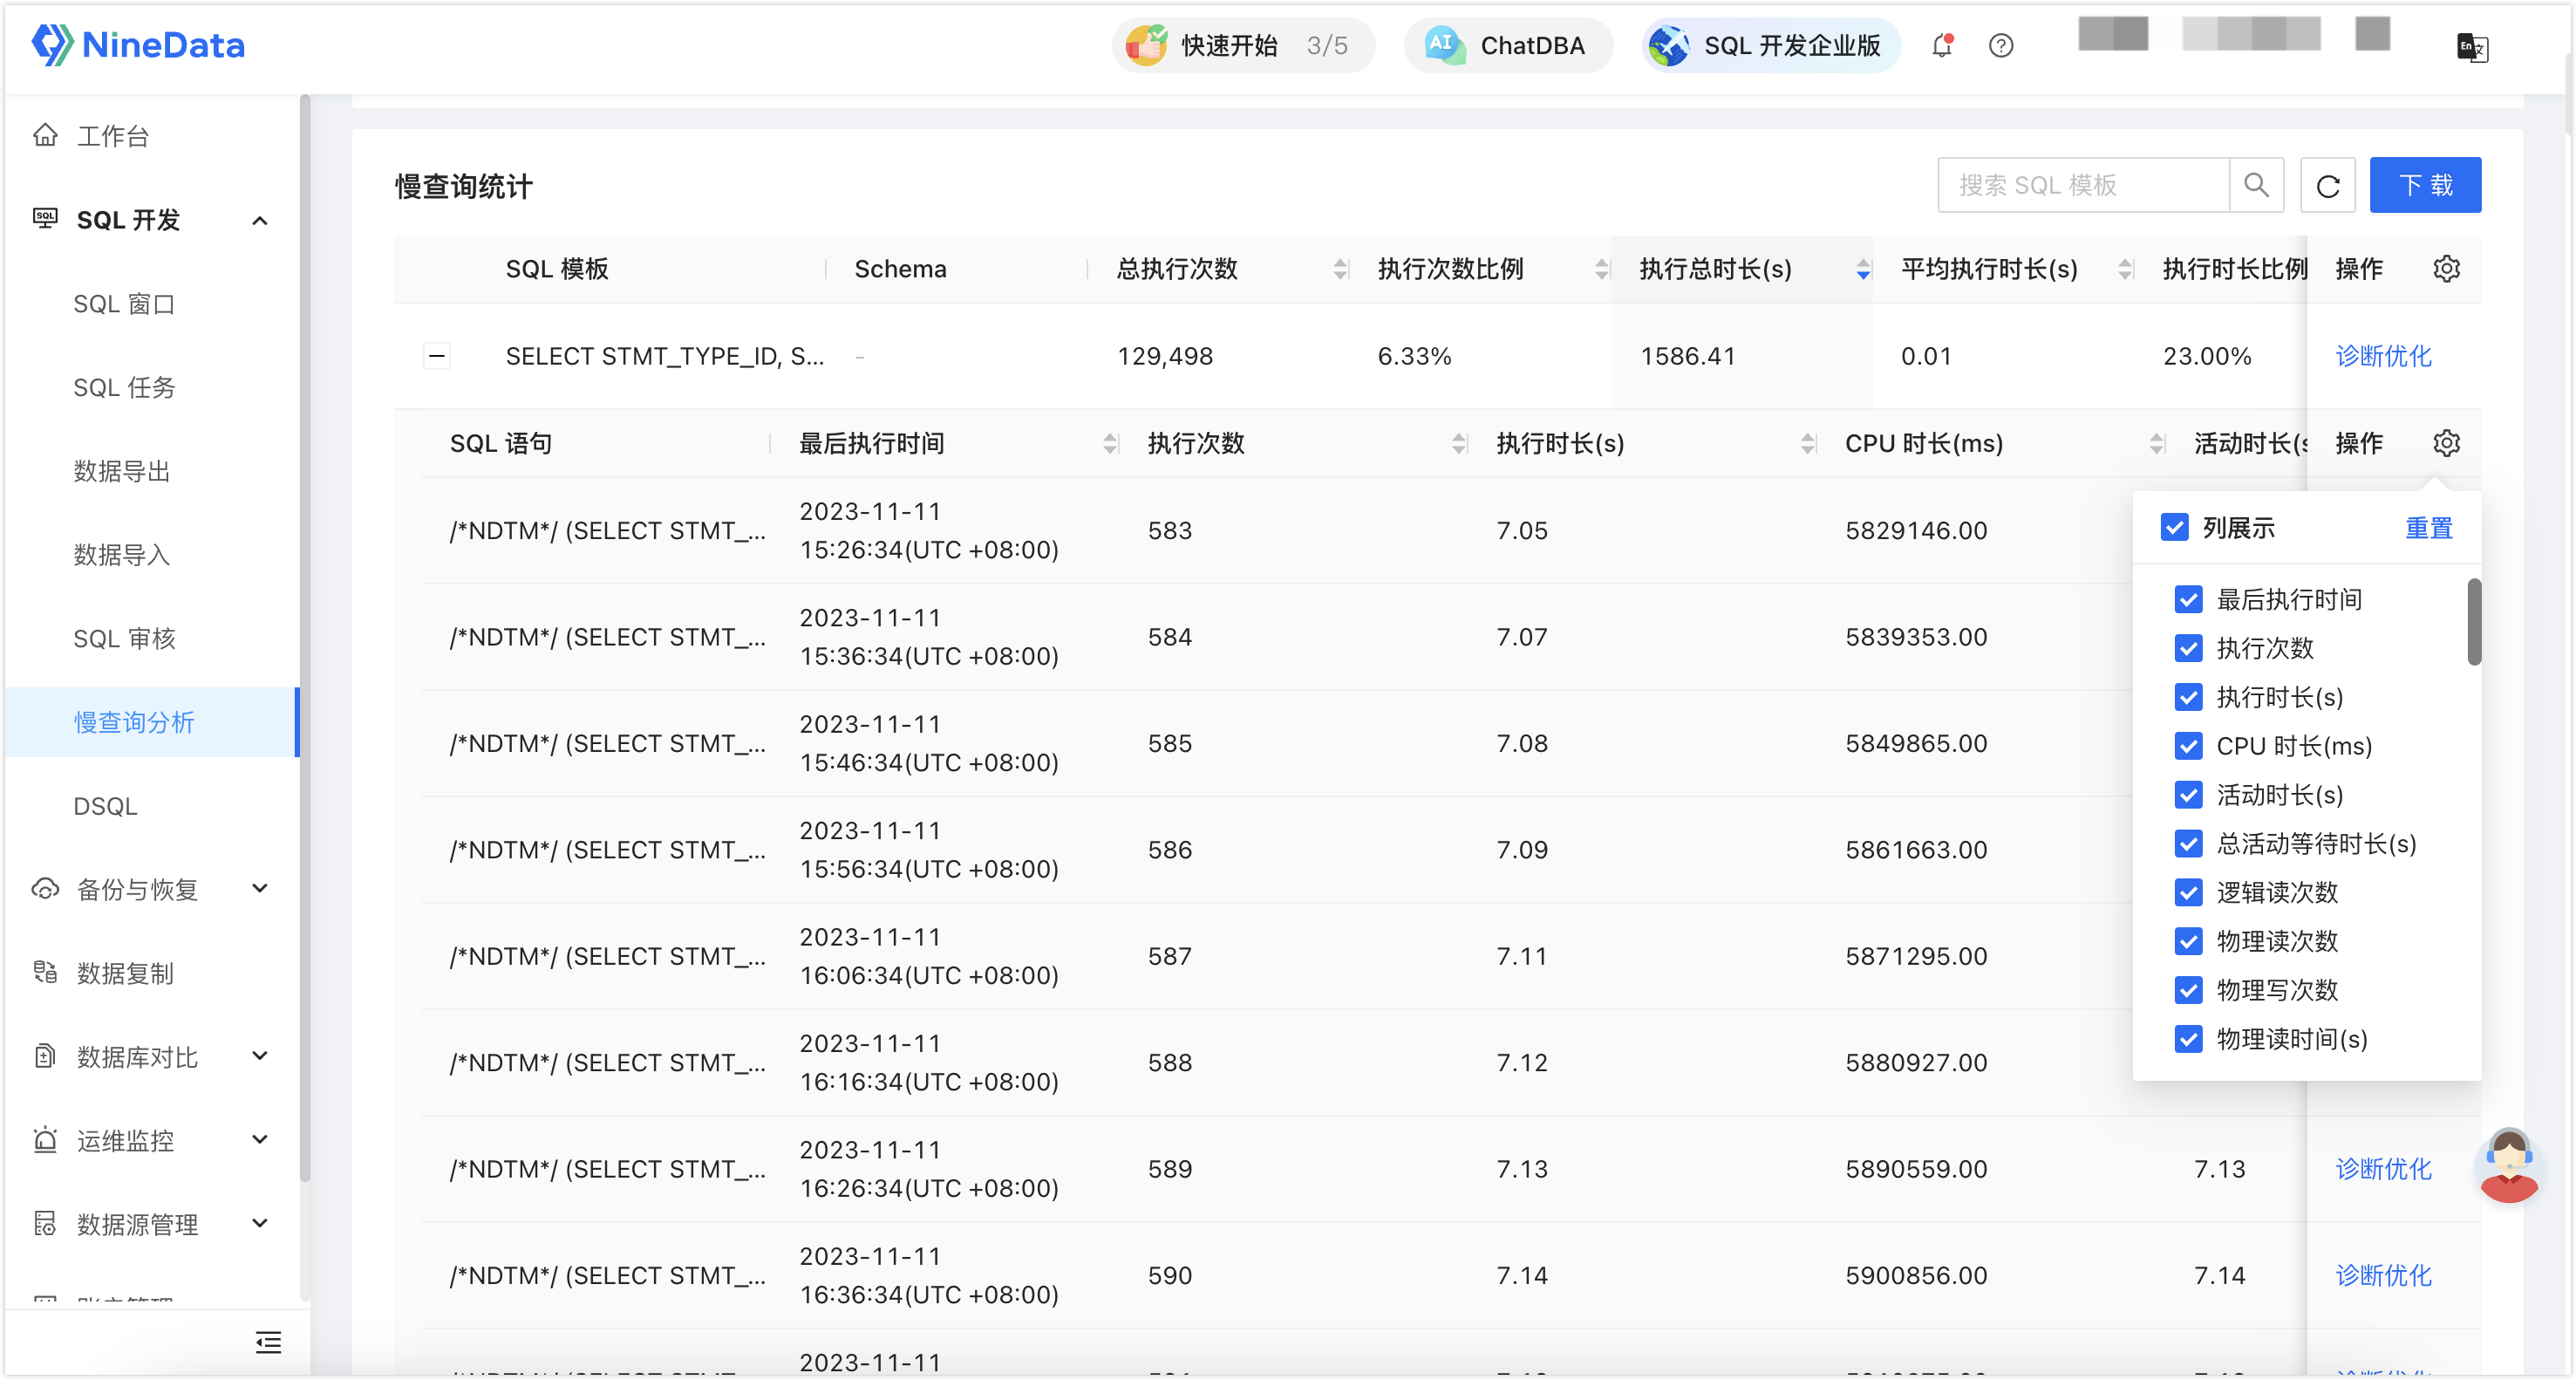
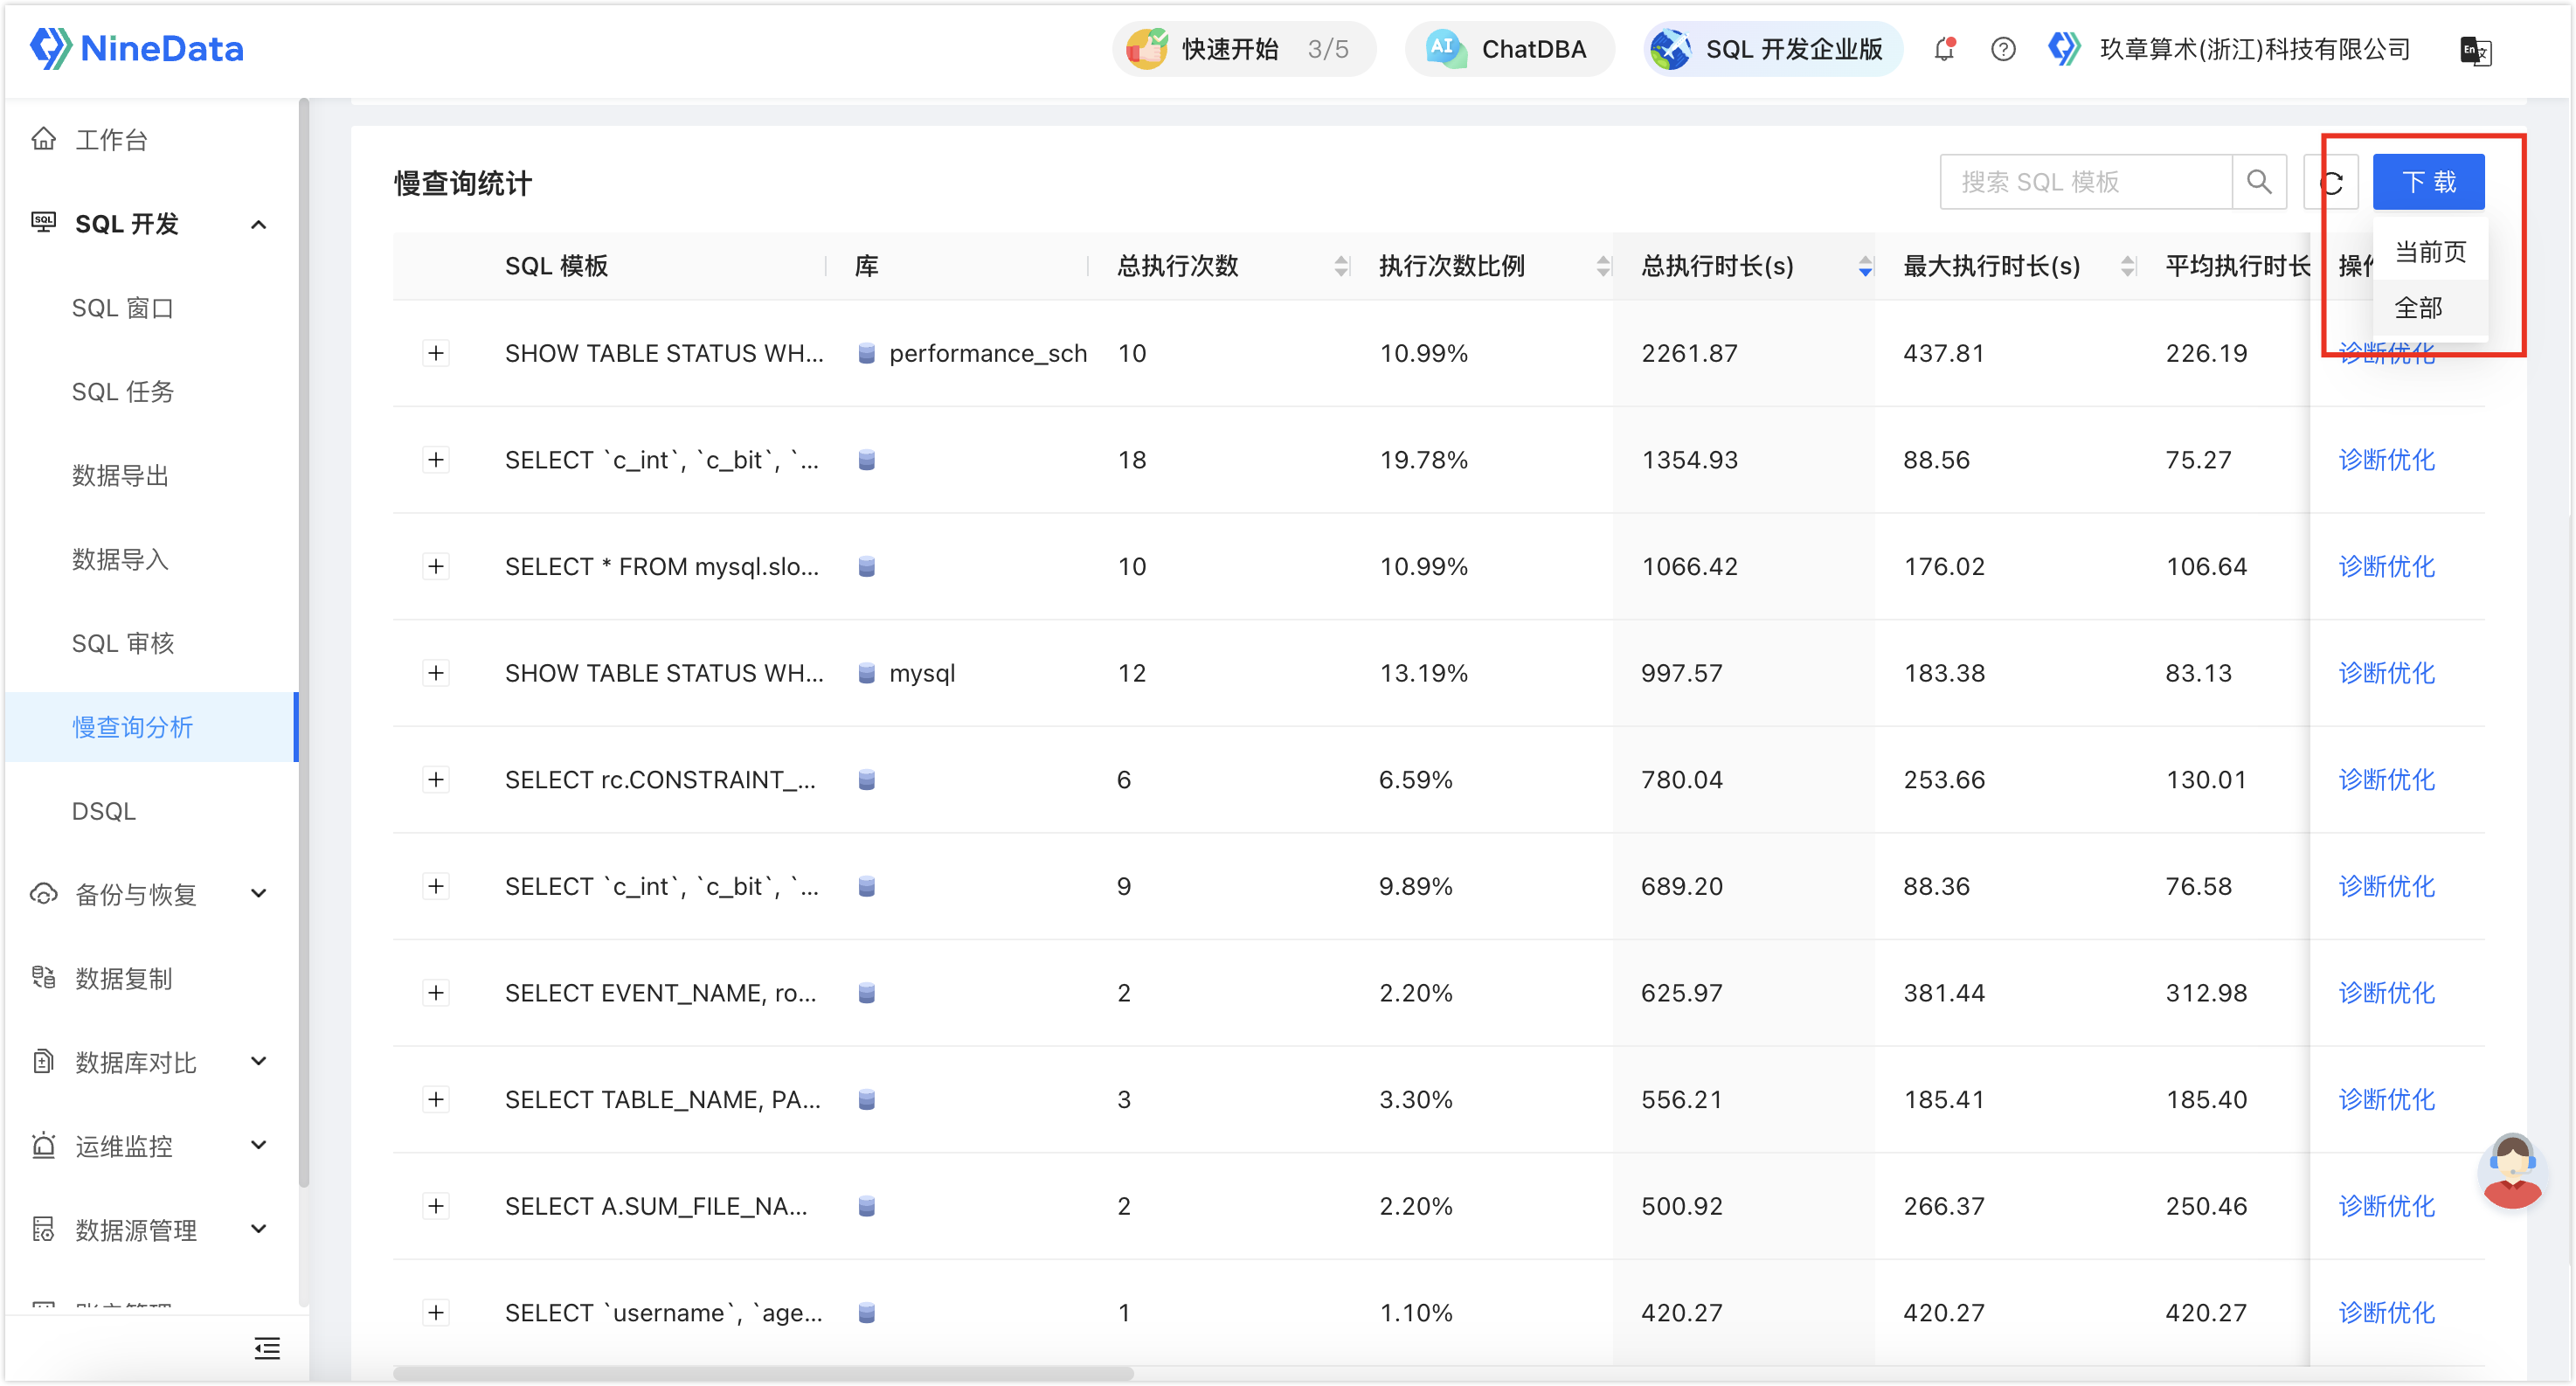
Open slow query statistics to view slow SQL grouped by SQL template. Expand a template to view the related SQL statements and execution details.
Diagnose And Optimize SQL
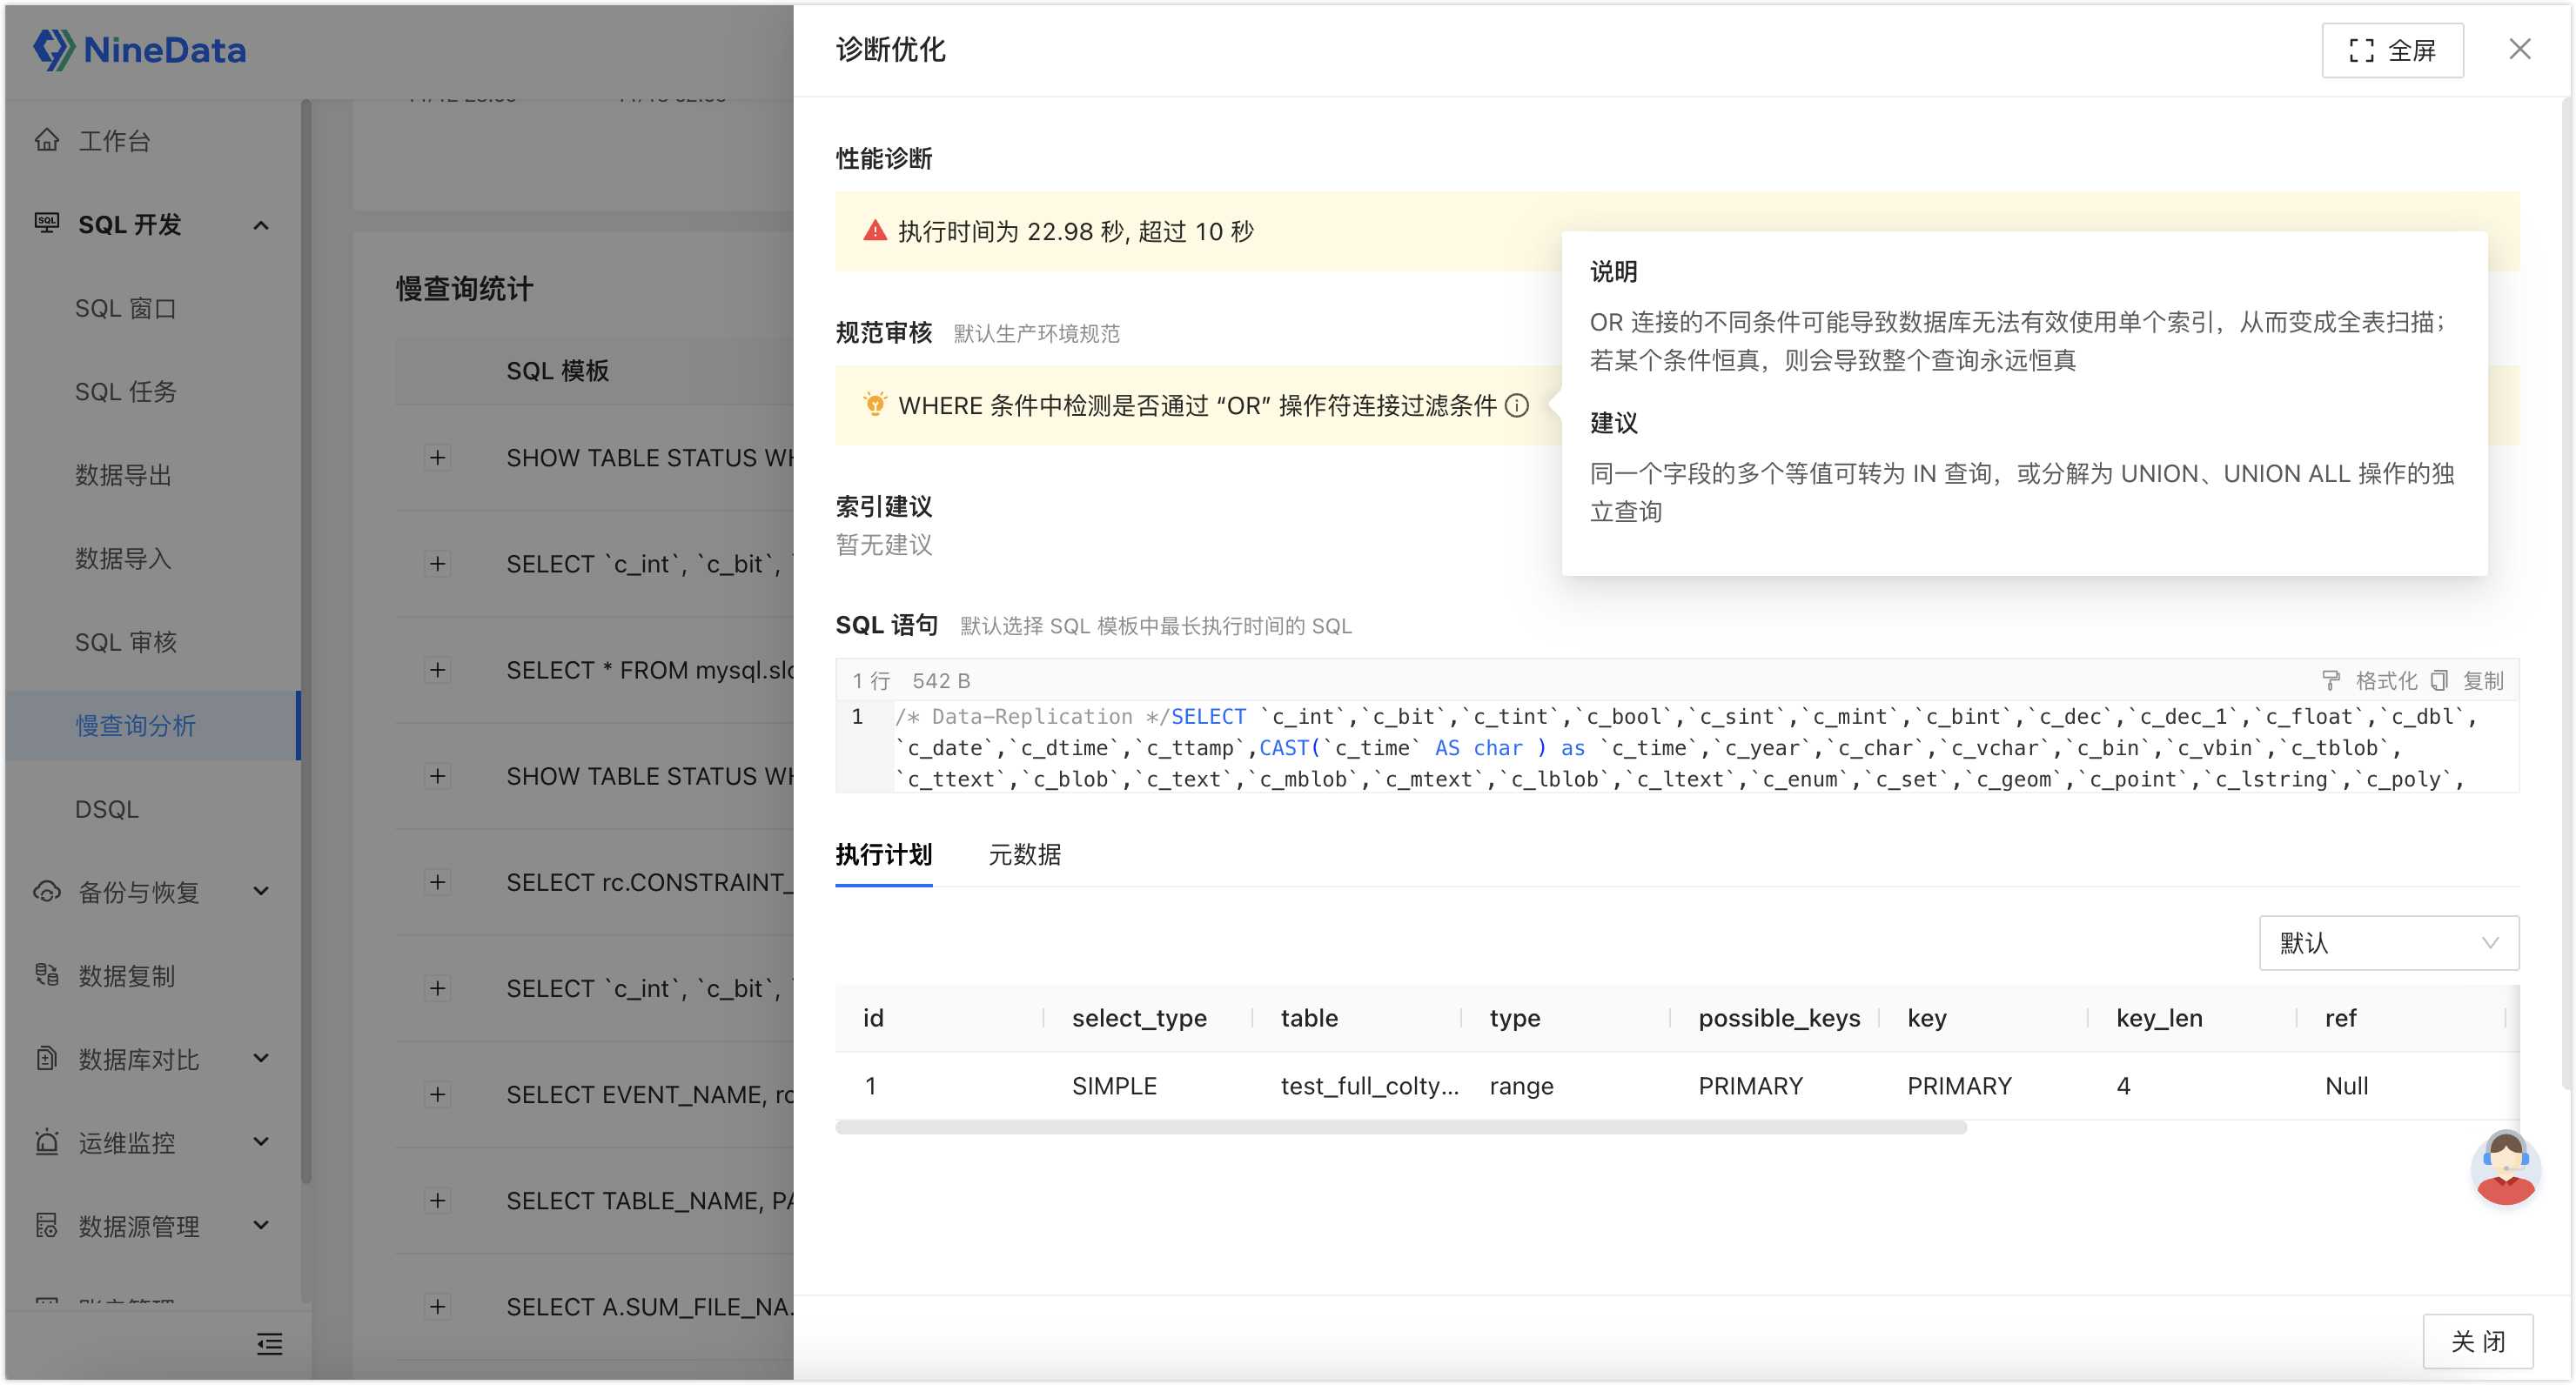
Open diagnostic optimization to review performance diagnostics, standard review results, and index recommendations.
Use Dashboards And Reports
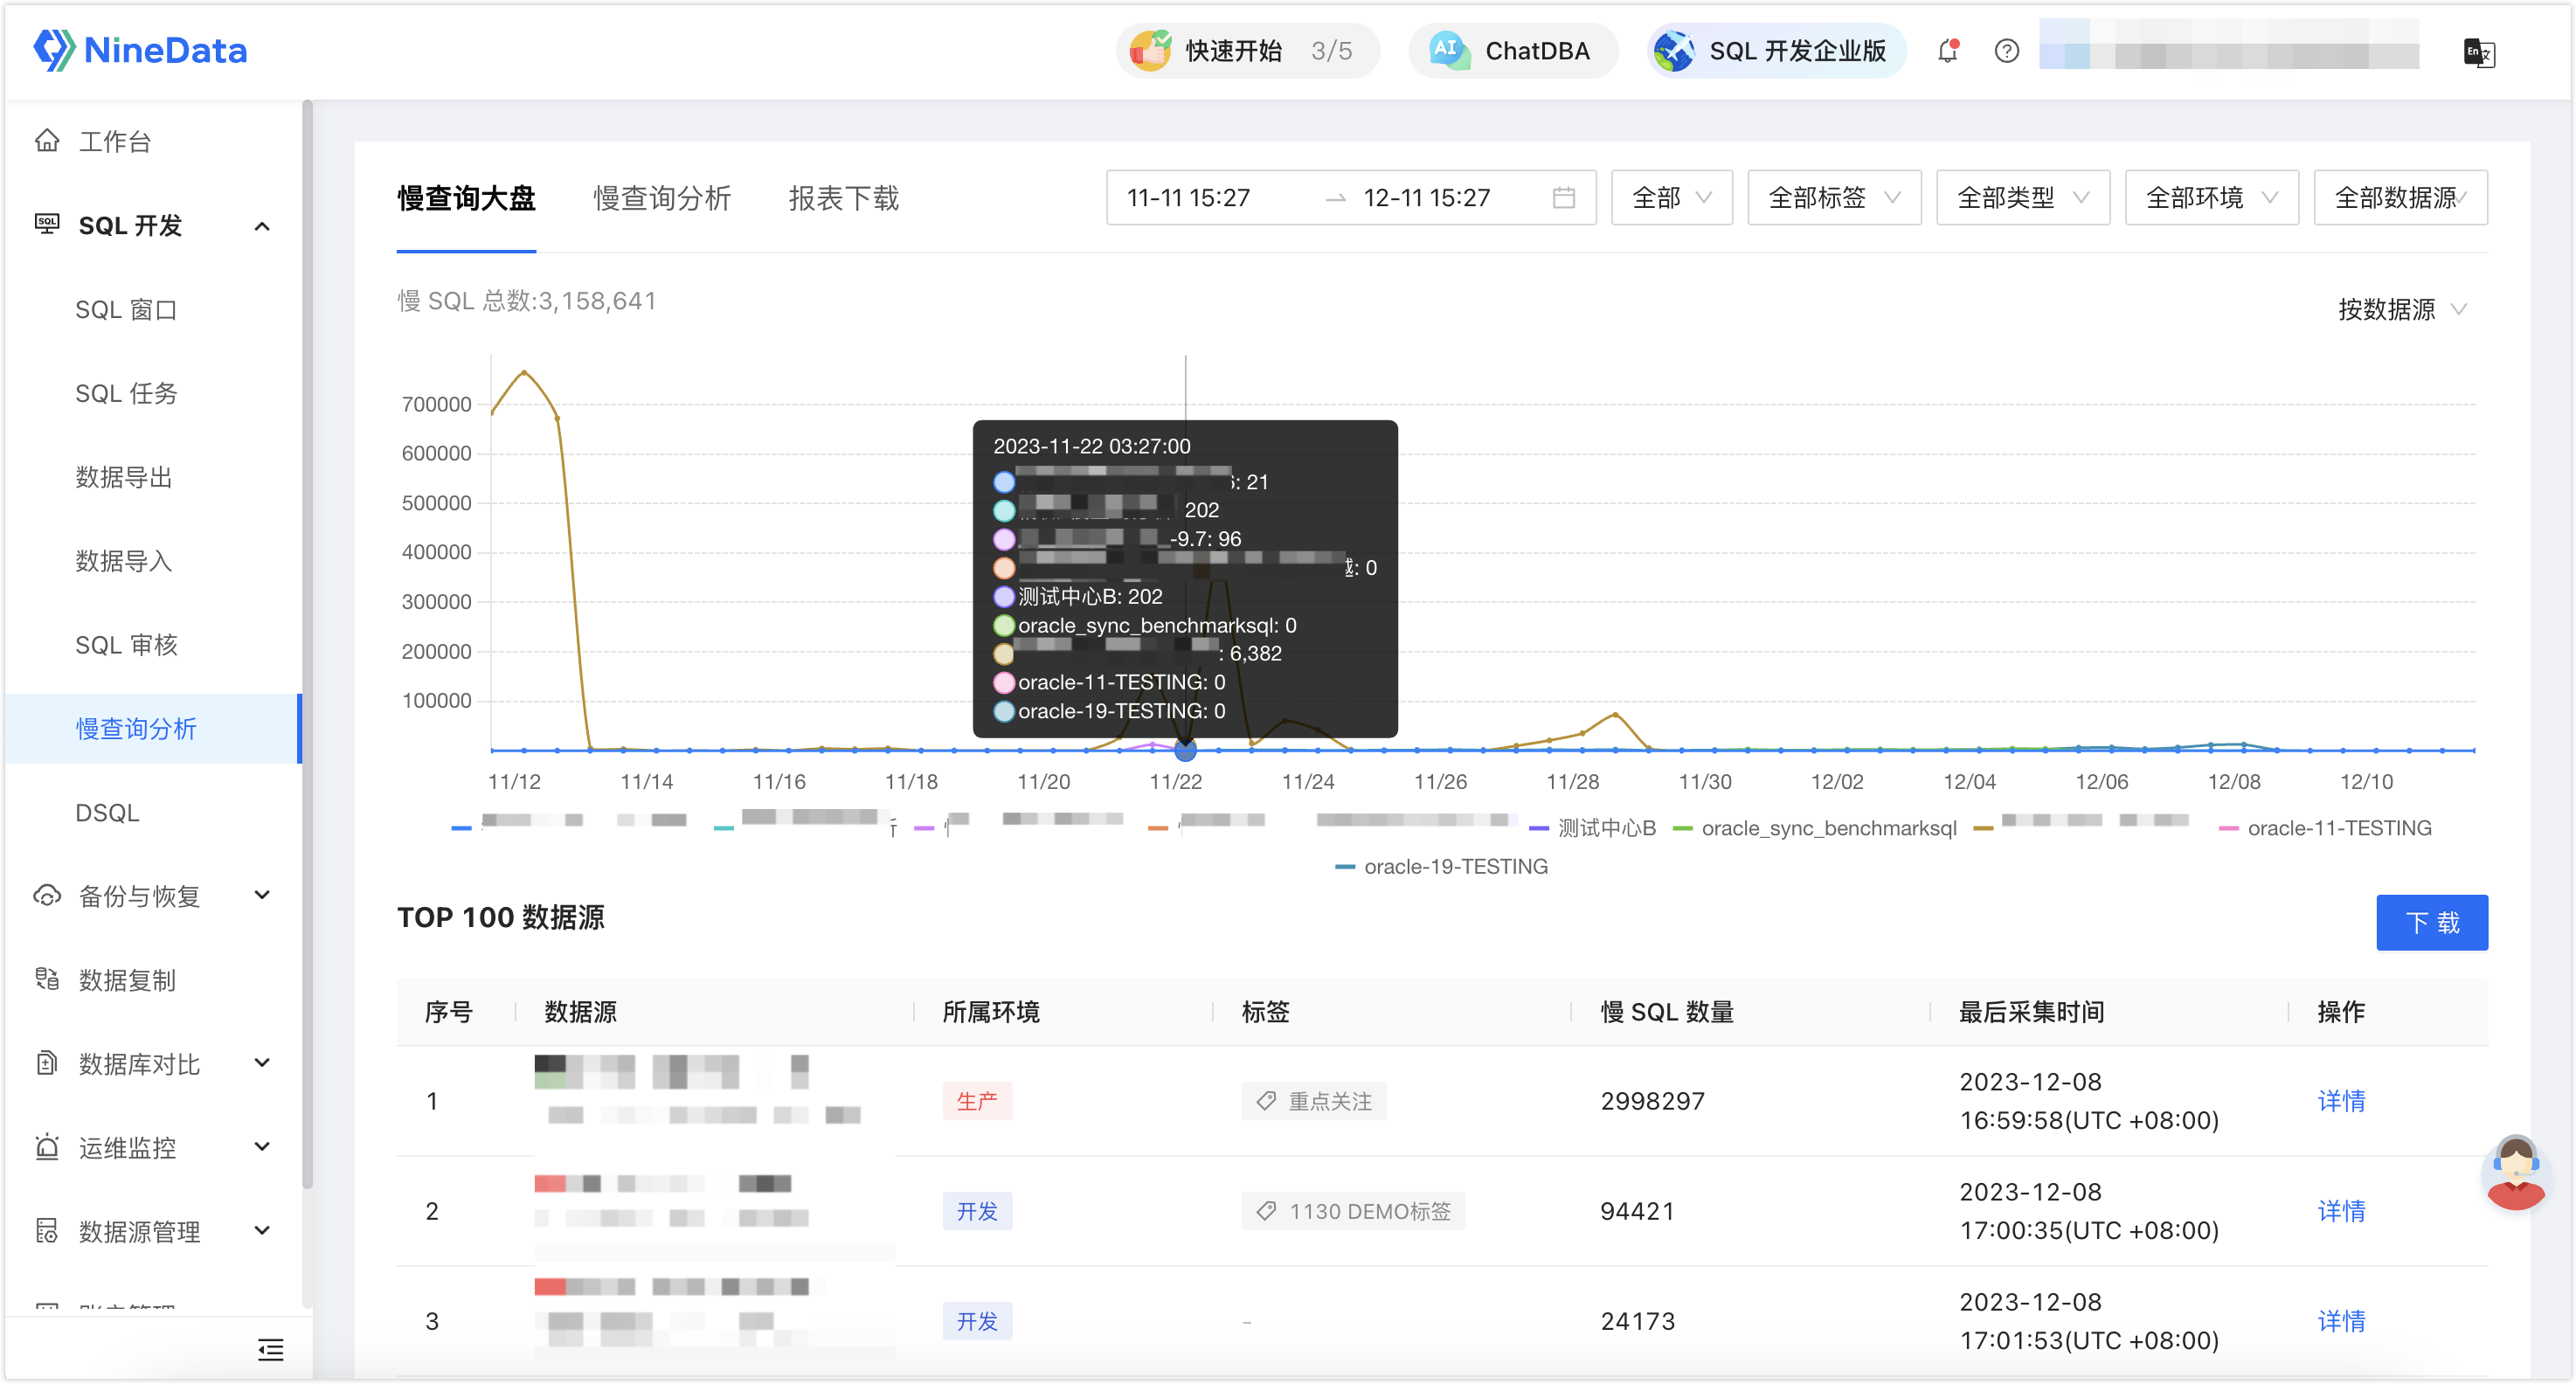
Slow Query Dashboard
Use the dashboard to view slow queries by data source, environment, tag, and data source type.
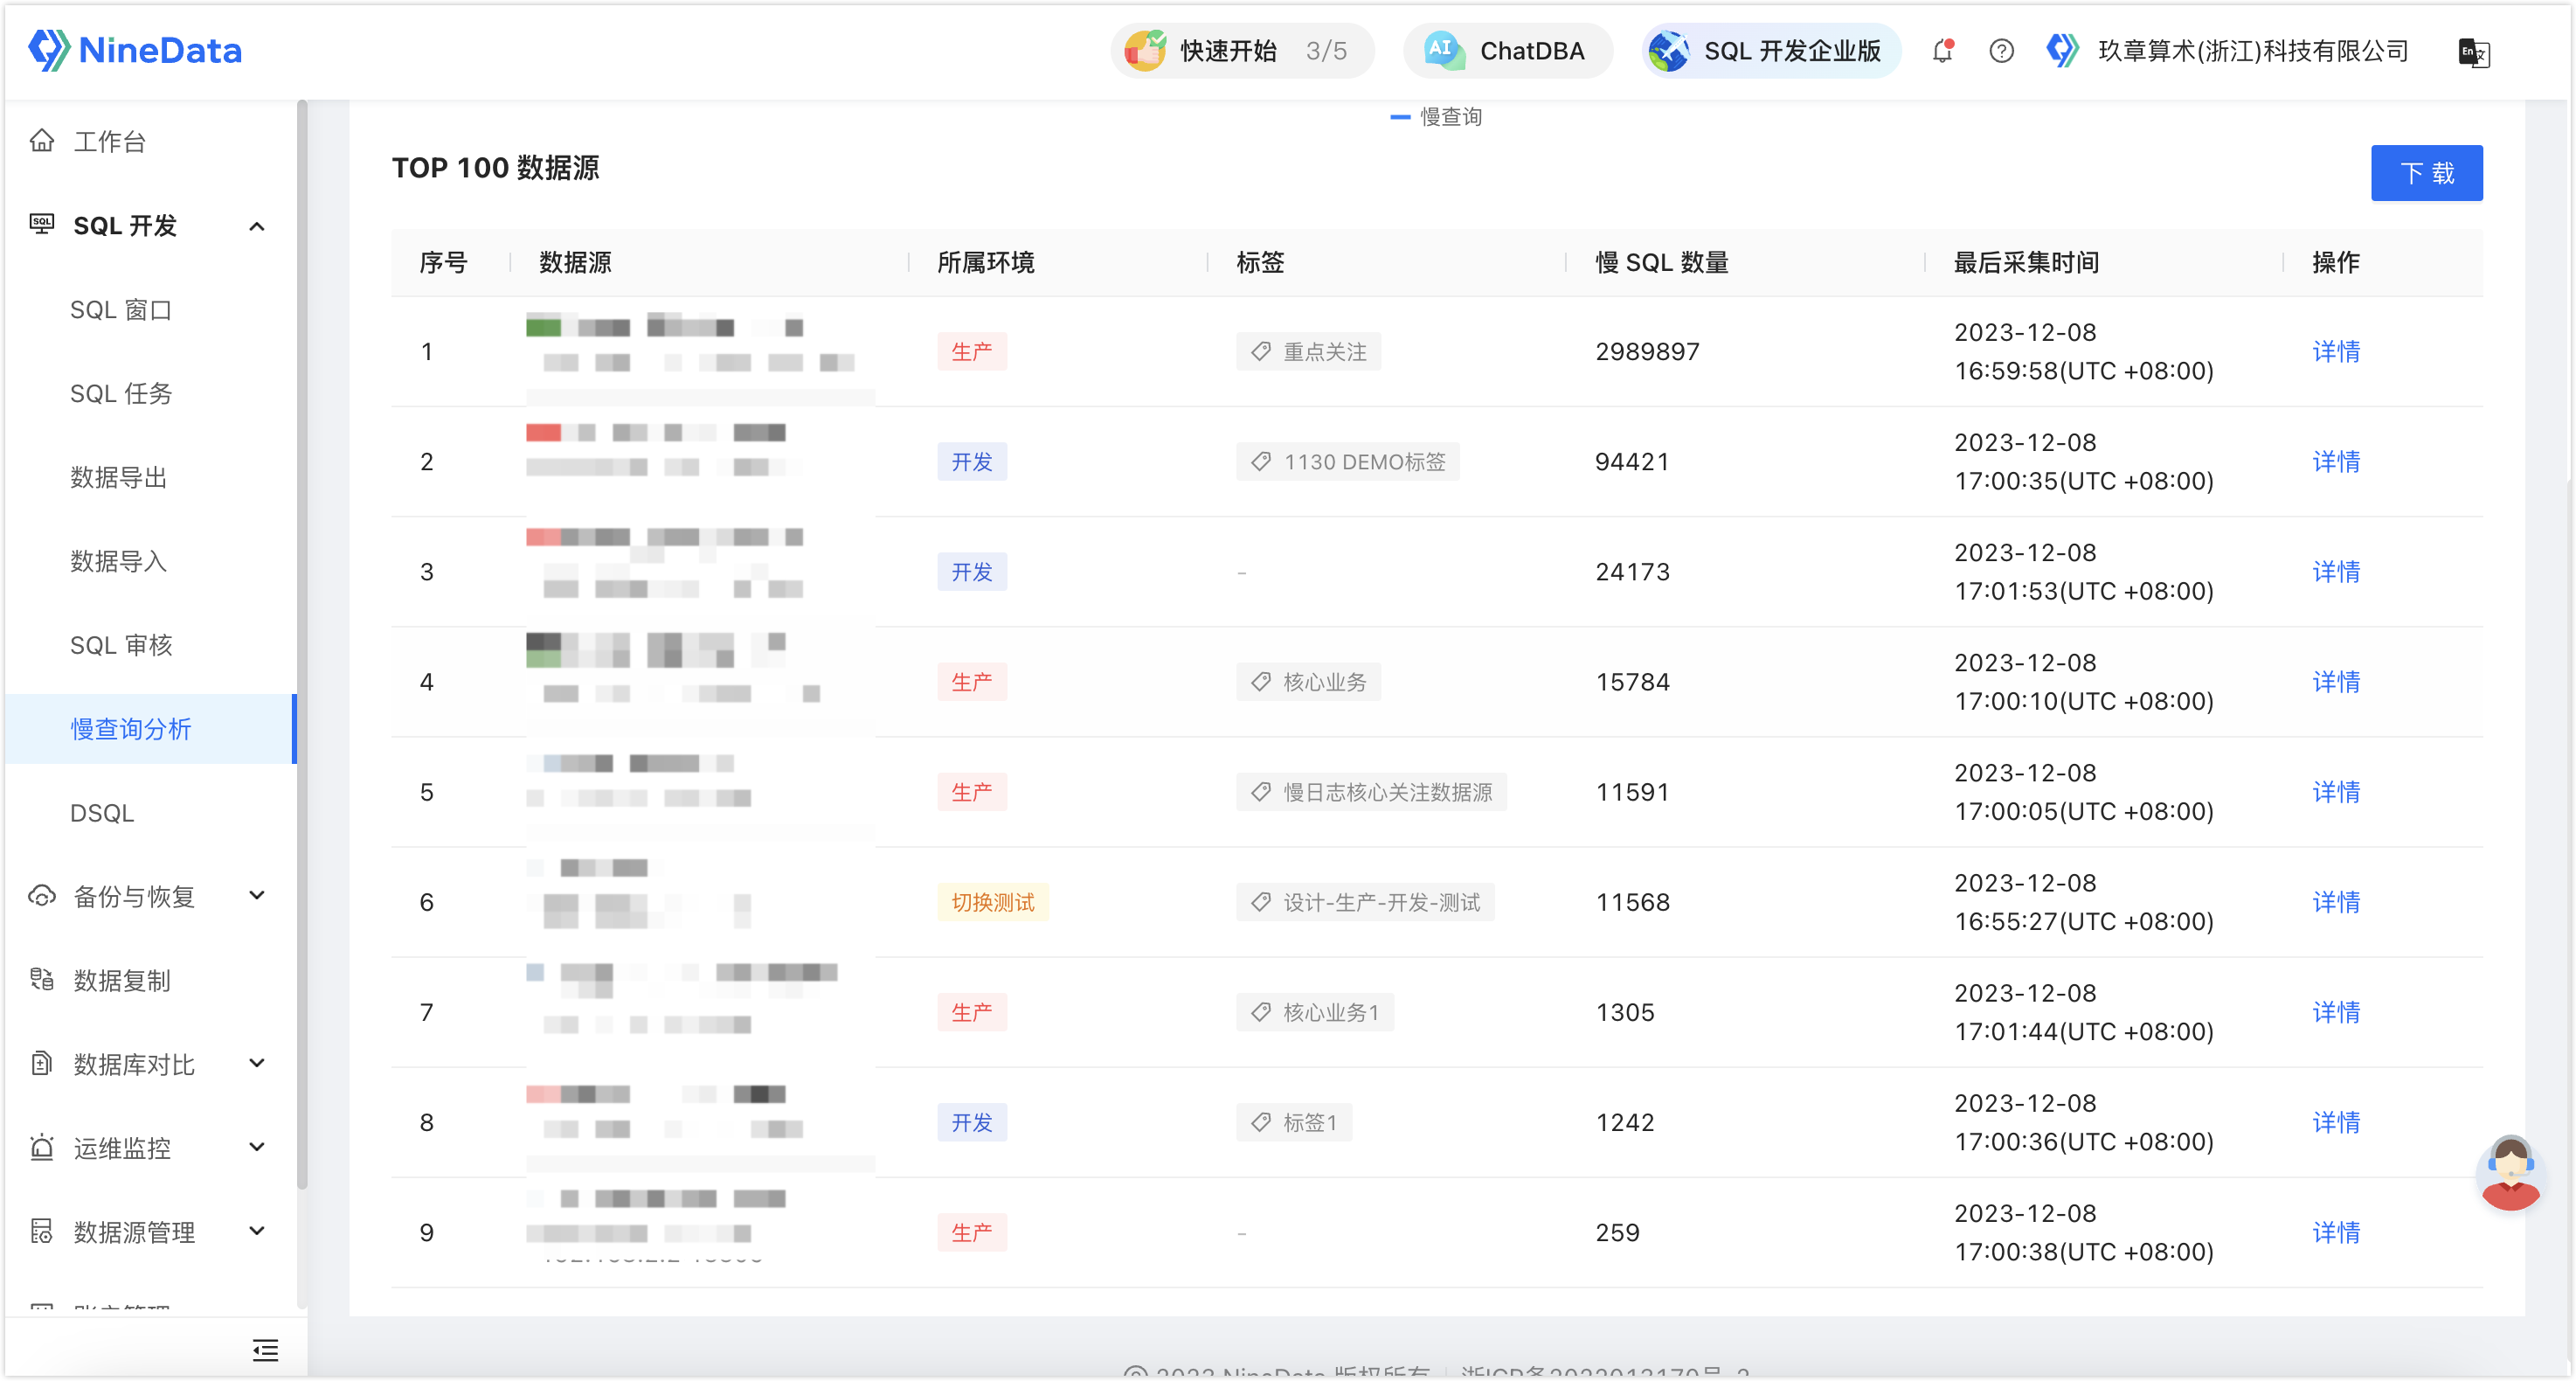
Top Data Sources
Review the top data sources by slow query count and open the details page for focused optimization.
Report Download
Download a PDF report that summarizes slow SQL in the selected time range. Use the report to assign optimization work to developers.
Result
Slow Query Analysis centralizes slow SQL collection, diagnostics, dashboards, and reporting. Teams can identify high-impact SQL, review recommendations, and track optimization work with less manual log analysis.