Slow Query Analysis
NineData Slow Query Analysis helps developers and DBAs find slow SQL, diagnose database performance bottlenecks, and review optimization recommendations. It covers slow query collection, diagnosis, optimization, and report download.
Background
Slow queries can affect enterprise databases for many reasons, including complex SQL, missing or inefficient indexes, large data scans, and insufficient hardware resources. These queries consume more database resources, increase response time, and may make business applications unavailable.
Slow query analysis monitors abnormal queries that affect database performance. Use it to identify bottlenecks, improve query performance, and reduce application response time.
What is NineData Slow Query Analysis?
NineData Slow Query Analysis identifies queries that affect database performance and provides optimization recommendations to improve database efficiency and stability.
NineData Slow Query Analysis provides these capabilities:
- Slow query collection: Collect and record queries that affect database performance. Records include the SQL statement, execution time, returned rows, and other details.
- Slow query diagnosis: Analyze collected slow queries to identify causes such as missing indexes, suboptimal table design, or inefficient SQL.
- Slow query optimization: Generate optimization guidance based on diagnosis results, such as adding or modifying indexes, adjusting table structures, or rewriting SQL.
- Multi-data-source coverage: View slow query records for different database types on one page, and filter or group them by time, data source type, environment, tag, and other dimensions.
- External source collection: If slow logs are already centralized in Elasticsearch or collection comes from Alibaba Cloud, Huawei Cloud, Tencent Cloud, or AWS managed databases, connect them through External collection sources.
Use cases
- Database performance optimization: Identify slow SQL when database performance deteriorates or query execution time increases.
- SQL development and debugging: Evaluate query performance during SQL development and identify optimization opportunities.
- Database operations: Monitor database performance, detect issues earlier, and support ongoing performance tuning.
Before you begin
- You have created or joined an organization, and this organization has subscribed to either DevOps Pro or DevOps Enterprise. Please ensure that your annual or monthly subscription is still active. For more information, please refer to Manage Organizations.
- Your current account has switched to the target organization. For more information, please refer to Switching to an Organization.
- You are using MySQL, MariaDB, TDSQL MySQL, PostgreSQL, SQL Server, Db2, Oracle, OceanBase MySQL, OceanBase Oracle, Dameng (centralized), TDSQL PostgreSQL, TDSQL Oracle, KingbaseES PostgreSQL, KingbaseES Oracle, TiDB, DWS, PolarDB Oracle, PolarDB-X, Vastbase, or GBase8a for direct database collection.
- Add the data source that you want to analyze to the NineData console. See Create Data Source.
- For MySQL data sources, including MySQL instances from different cloud providers, slow query logging is enabled and written to the
mysql.slow_logtable. See Appendix: Enable MySQL slow query logging for instructions. - For PostgreSQL data sources, the pg_stat_statements plugin has been installed and configured. See Appendix: Install the pg_stat_statements plugin.
- If slow logs are not stored in a database table, use an external collection source to collect them from Elasticsearch, Alibaba Cloud, Huawei Cloud, Tencent Cloud, or AWS.
Procedure
Follow these steps to enable collection, review slow query trends, and inspect slow query details.
Enable slow query collection
Enable Slow Query for the target data source before you use slow query analysis.
Sign in to the NineData Console.
Go to DevOps > Slow Query.
On the Slow Query page, the data source list shows all data sources that support slow query analysis. Click the toggle in the Slow Query column for the target data source.
tipIf slow query logging is not enabled for your data source, the page displays an error. See the Appendix, enable the required logging, and try again.
View the slow query dashboard
The slow query dashboard visualizes slow query trends. Use it to identify abnormal performance fluctuations, prioritize investigation, and improve database stability.
Sign in to the NineData Console.
Go to DevOps > Slow Query.
On the Slow Query Diagram tab, the dashboard shows slow query trend charts for all data sources that had slow query analysis enabled within the last 12 hours. Use these controls to filter, group, and download slow query data.
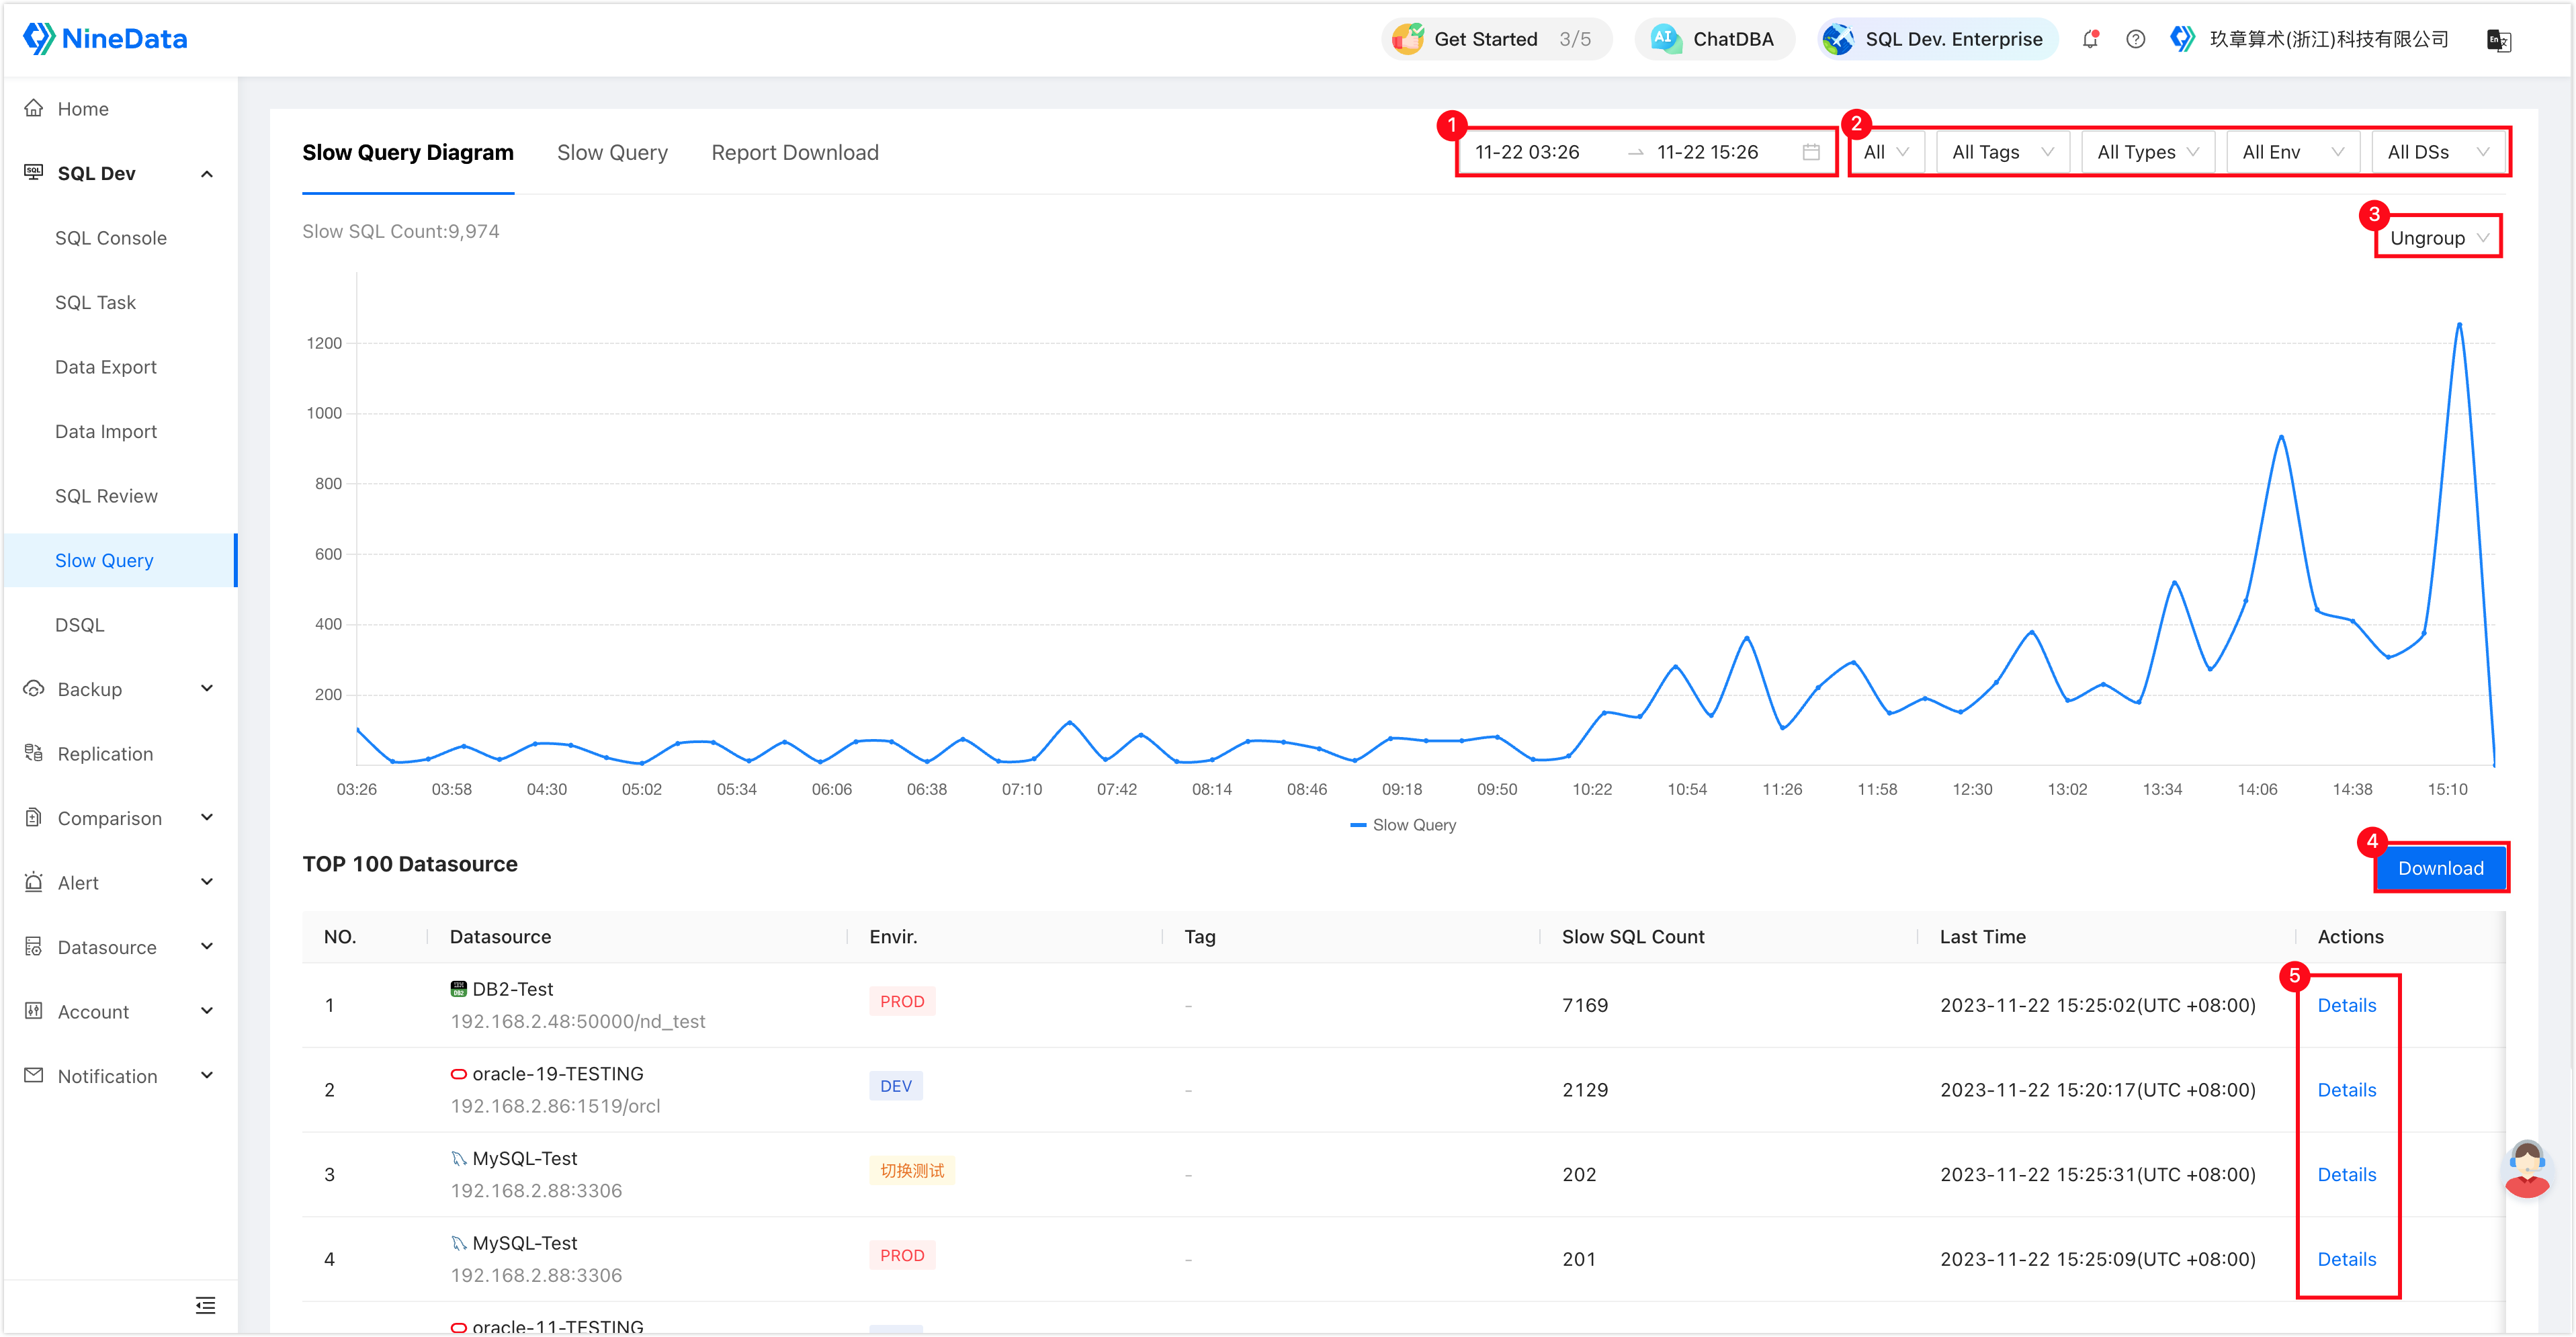
Number Feature Description 1 Time range for slow queries Choose the time range for slow queries on the dashboard. Supports custom start and end times and preset options such as Last 12 Hours, Last 1 Day, Last 3 Days, Last 1 Week, Last 2 Weeks, Last 1 Month. 2 Data source filtering Filter data sources by bookmark status, tag name, data source type, environment name, or data source name. 3 Group display Group slow queries by tag, environment, data source type, or data source name. 4 Download slow query report Download a slow query report based on the filtered dashboard. The report is an Excel spreadsheet containing key information such as data source name, connection address, slow query count, and collection time. After generating the report, go to the Report Download tab and click Download in the Actions column of the target report. 5 View slow query details Click Details in the Actions column of the target data source to navigate to the slow query details page. See View slow query details.
View slow query details
Sign in to the NineData Console.
Go to DevOps > Slow Query.
On the Slow Query Diagram tab, click Slow Query Details in the Actions column of the target data source.
By default, the Slow Query Details page displays all slow query records generated by this data source within the last 3 days. Adjust the time range if required.
tipOnly slow query records within the last 3 days are displayed.
Slow query analysis has two layers. The outer layer is the SQL Template, which is the SQL framework without specific parameters. All slow queries using the same SQL template are recorded under this template. The inner layer contains the specific SQL statements. Click + to the left of the target SQL Template to expand all SQL statements under this template and view details such as databases, execution time, returned rows, and executing users.
Click Optimize to view performance diagnosis, rule checks, index suggestions, and other optimization information for the slow query.
tipThe Optimize for the SQL Template displays the record for the SQL statement with the longest execution time under that template.
Click Download in the Slow Query Statistics section. Then select either Current Page or All to generate the report. Return to the previous page, click the Report Download tab, and click Download in the Actions column of the target report.
tipIn the Slow Query Statistics section, search by keyword to quickly locate specific slow queries. Supported filter criteria include Template, Database, Host, and User.
Result
Slow Query Analysis displays trend charts, slow SQL templates, individual slow SQL statements, diagnosis details, and downloadable reports for the selected data source. Use the diagnosis and report data to prioritize index, SQL, or table-structure optimization.
Appendix: Enable MySQL slow query logging
Connect to the MySQL database using an account with SYSTEM_VARIABLES_ADMIN or SUPER privileges. For privilege details, see System Variable Privileges.
Run these commands to enable the slow query log:
SET GLOBAL slow_query_log=1; // Enable the slow query log.
SET GLOBAL log_output='TABLE'; // Store the slow query log in the `slow_log` table within the `mysql` database.tipMonitor the size of the
slow_logtable. If the table becomes too large and affects your business, clear it using theTRUNCATE TABLE mysql.slow_logcommand.Optional: configure these parameters for your collection policy:
SET GLOBAL long_query_time=1; // Queries taking more than 1 second will be defined as slow queries.
SET GLOBAL log_queries_not_using_indexes=1; // Queries not utilizing indexes will be defined as slow queries.
To disable the slow query log in the MySQL database, execute
SET GLOBAL slow_query_log=0;.
Appendix: Install the pg_stat_statements plugin
In your PostgreSQL database, execute
CREATE EXTENSION IF NOT EXISTS pg_stat_statements;to create the pg_stat_statements plugin.Open your postgresql.conf configuration file and set these two parameters:
shared_preload_libraries = 'pg_stat_statements'
pg_stat_statements.track = all
Appendix: Bind tags to data sources
Configure tags for specific data sources to group slow queries on the dashboard by business logic, department, or other requirements. This helps you identify and resolve performance bottlenecks more precisely.
- Create tags.
- Go to "DevOps" > Slow Query.
- Click the Slow Query tab, locate the data source you want to bind a tag to, hover over the Tag column of the data source, and click the
 icon.
icon. - Click the drop-down menu for tags, select the target tag, and then click the
 icon to confirm the binding.