Debug Stored Procedures
NineData SQL Console provides a visual debugger for stored procedures, functions, and packages. Set breakpoints, step through code, monitor variables, and inspect DBMS output without writing separate debugging scripts.
Background
Enterprise databases often contain business logic for validation, batch processing, and statistical calculations. This logic is commonly implemented through stored procedures, functions, and packages.
Traditional debugging workflows are difficult because:
- Developers must manually write debugging scripts.
- Variable values, call stacks, and DBMS output are hard to inspect during execution.
- Exceptions can take time to reproduce and locate.
The SQL Console debugger helps database developers test and maintain database logic in a more controlled workflow.
Feature overview
Use the debugger to visually execute and debug stored procedures, functions, and packages.
- Execute database logic: Call stored procedures or functions directly and review return values or output.
- Debug step by step: Set breakpoints, step through code, inspect variables, and capture exceptions.
Use cases
Validate new stored procedures: Run newly developed logic step by step before release.
Troubleshoot production issues: Reproduce the execution path and locate the source of an exception.
Optimize complex logic: Inspect slow or inaccurate procedures and identify bottlenecks or logic defects.
Before you begin
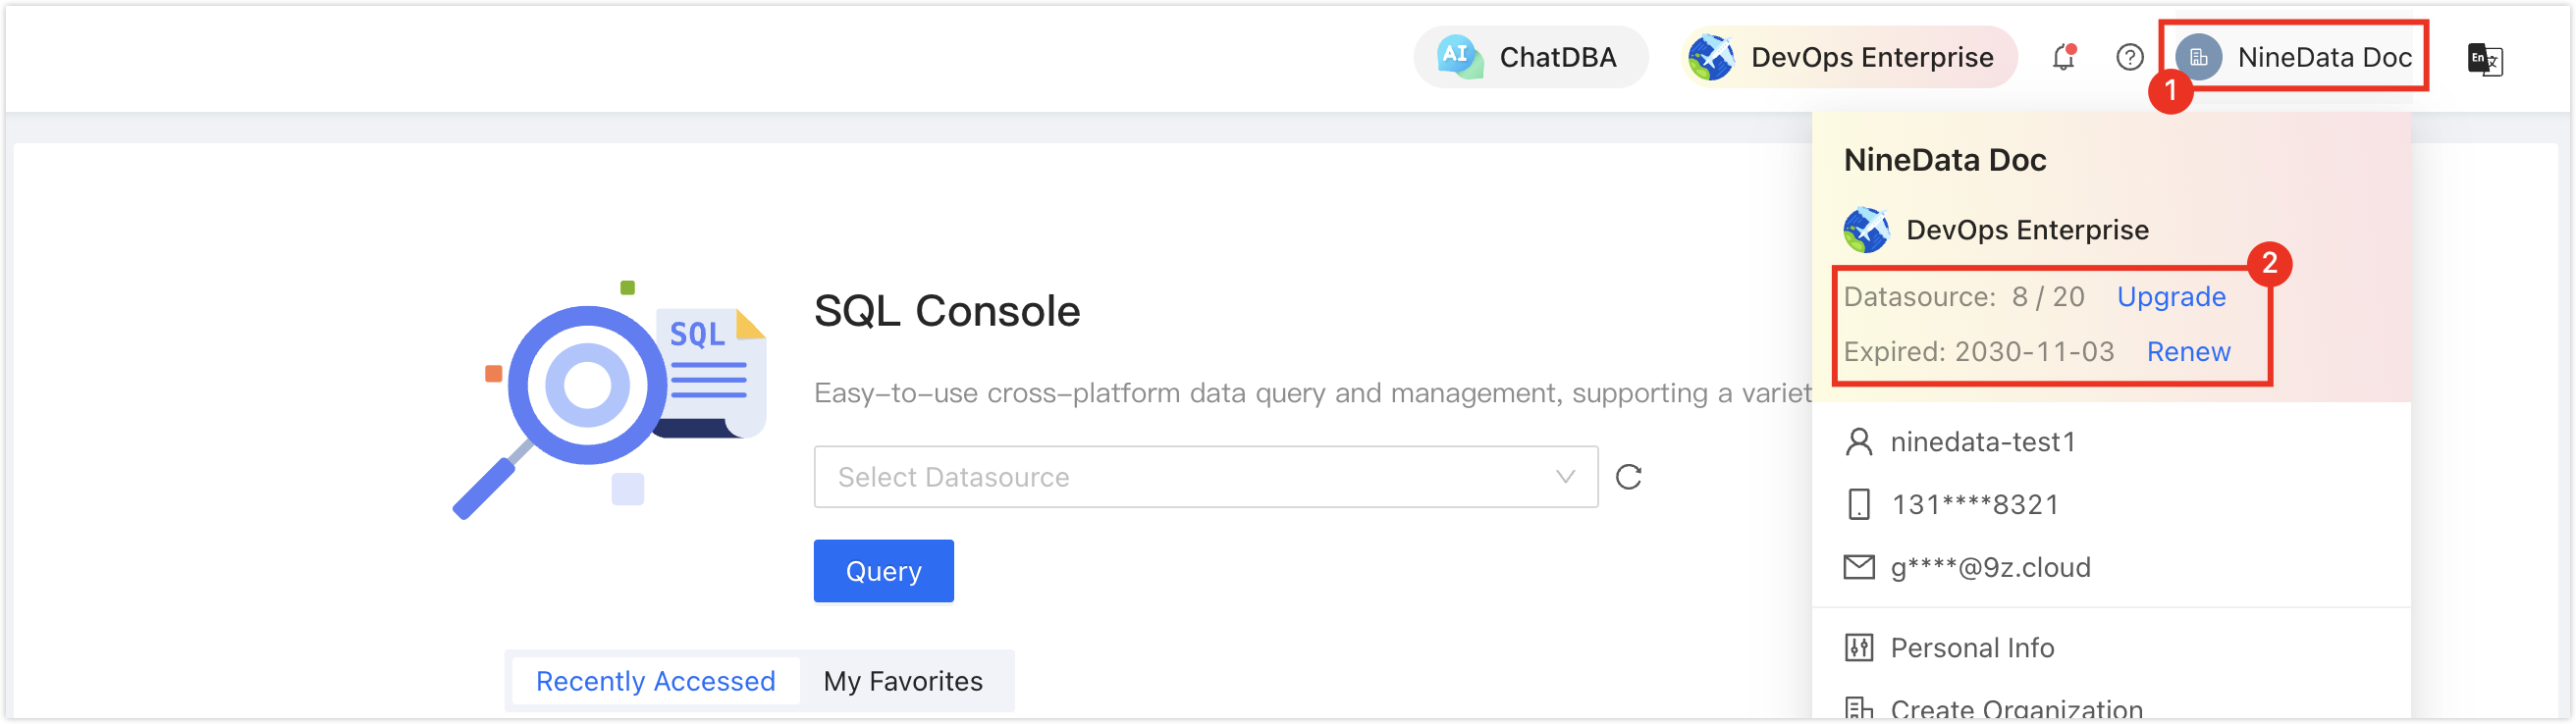
In the commercial versions (DevOps Pro, DevOps Enterprise), make sure your monthly or yearly subscription has not expired. An expired subscription may prevent you from using the Database DevOps service. Check the remaining quota and expiration date in the NineData Console header.
- The data source type is Oracle or PostgreSQL.
- Your database account has the required permissions to execute and debug objects and view object definitions.
Procedure
In the navigation tree on the left side of the SQL Console, expand the target non-table object, such as a stored procedure, function, or package.
Right-click the target non-table object and click Debug Procedures|Debug Function|Debug Package to open the debugging page.
tip- If the debugging option is not available in the right-click menu, confirm that the target non-table object has been compiled.
- Non-table objects that fail compilation are marked with a red exclamation mark. Hover over the mark to view the error details, fix the issue, and try again.
- The right-click menu provides a compile object feature. If the error is not caused by the object definition itself, fix the related issue and use compile to verify the object again.
Use the debugging toolbar to control the session.
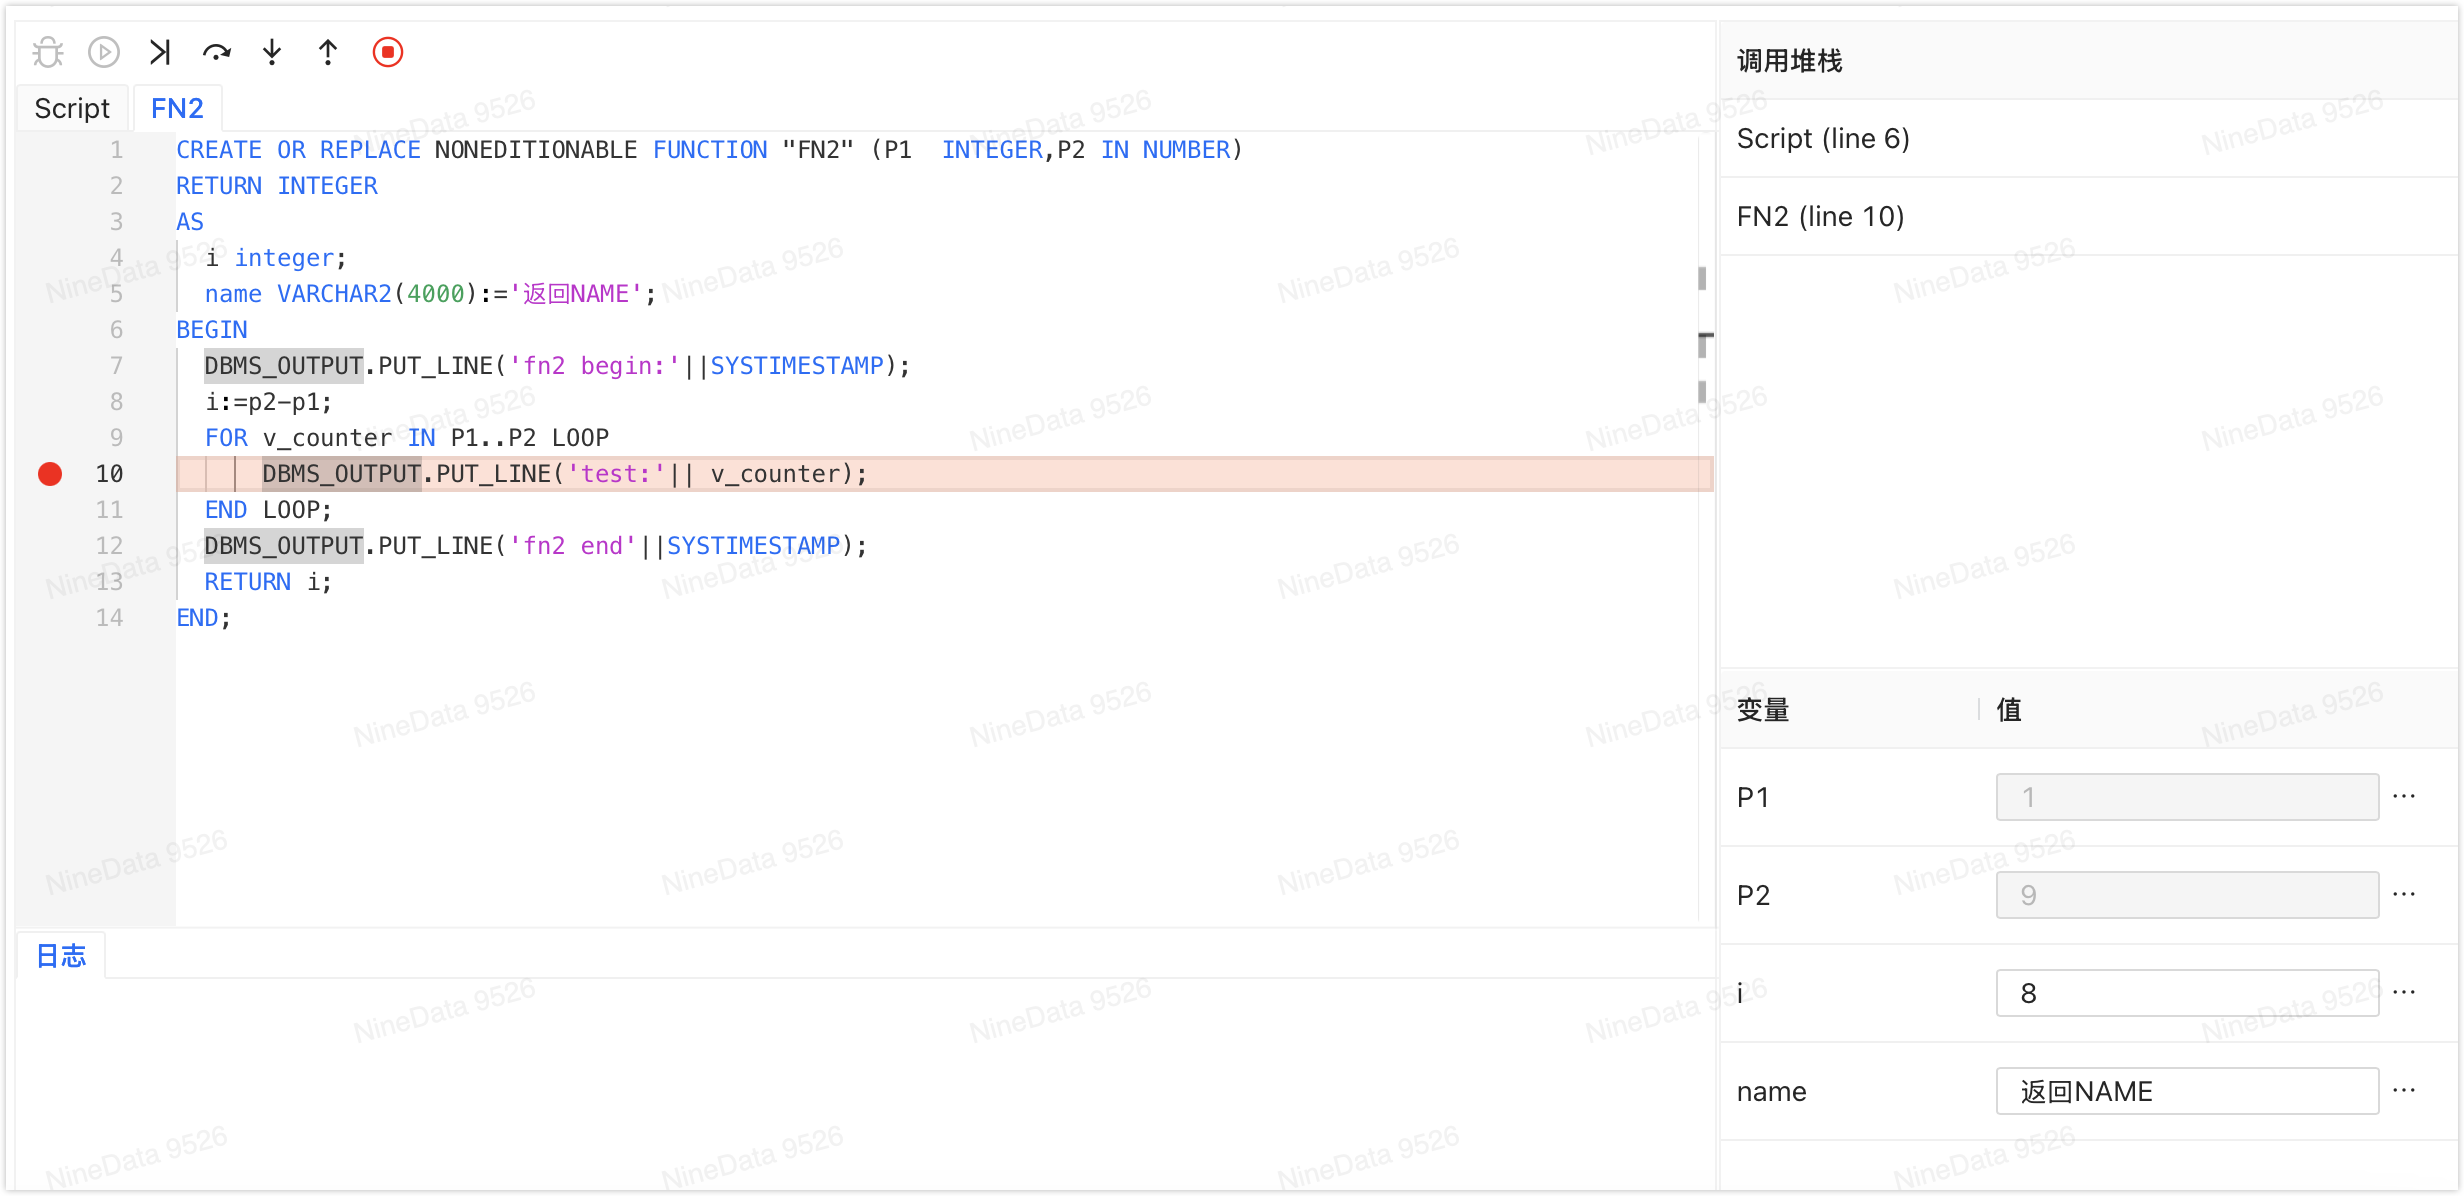
Operation Description  Debug
DebugStart the debugging session and enter initial test variable values.  Start
StartRun the code and pause at breakpoints.  Resume
Return to the beginning of the debugging session.  Step Over
Execute the current line without entering the called subprogram or function.  Step Into
Execute the current line and enter the called subprogram or function.  Step Out
Finish the current subprogram or function and return to the caller.  Stop
StopStop debugging. View Variables During debugging, view or modify variable values in real time in the Variables area. View Logs (DBMS Output) After the debugging process finishes, view DBMS_OUTPUT.PUT_LINEoutput in the Logs area.
Result
The debugging page opens for the selected object. Start the session, step through the code, inspect variable values, and review DBMS output after execution.
Next steps
- Fix and compile the object again if the debugger exposes a syntax or runtime issue.
- Use the SQL Console to validate the data changes or output produced by the procedure.