SQL Console for Elasticsearch
Use NineData SQL Console to manage Elasticsearch data sources from a web workspace. Browse indexes, run Elasticsearch commands, and review execution results from one interface.
Background
Elasticsearch is an open-source distributed search and analytics engine for fast, scalable storage, search, and analysis of large structured and unstructured datasets.
As a distributed system, Elasticsearch provides high availability and horizontal scalability by storing data shards on multiple servers. It uses an inverted index to support efficient full-text search and analytical queries.
NineData SQL Console supports both visual index browsing and command-based Elasticsearch operations, so teams can manage Elasticsearch data sources without switching tools.
Feature overview
SQL Console provides these capabilities for Elasticsearch data sources.
| Feature | Description |
|---|---|
| Visual management | Access and view Elasticsearch indexes from a visual interface. |
| Editor | Run Elasticsearch commands in a command-line editor. |
| Workspace recovery | Reopen the SQL Console after a browser exit or crash and restore previously opened data sources and executed commands. The page state is stored in the cloud, so recovery is not tied to one browser or host. |
| Execution history | History records commands executed by the current account in the NineData console. Search by data source, execution time, command keyword, or other fields, then copy and rerun commands from history. |
Before you begin
Add the target Elasticsearch data source to NineData. For details, see Managing Data Sources.
In organization mode (DevOps Enterprise), you must have read-only, DML, or DDL permissions for the target data source.
tipRead-only permission supports query operations only.
In the commercial versions (DevOps Pro, DevOps Enterprise), make sure your monthly or yearly subscription has not expired. An expired subscription may prevent you from using the Database DevOps service. Check the remaining quota and expiration date in the NineData Console header.
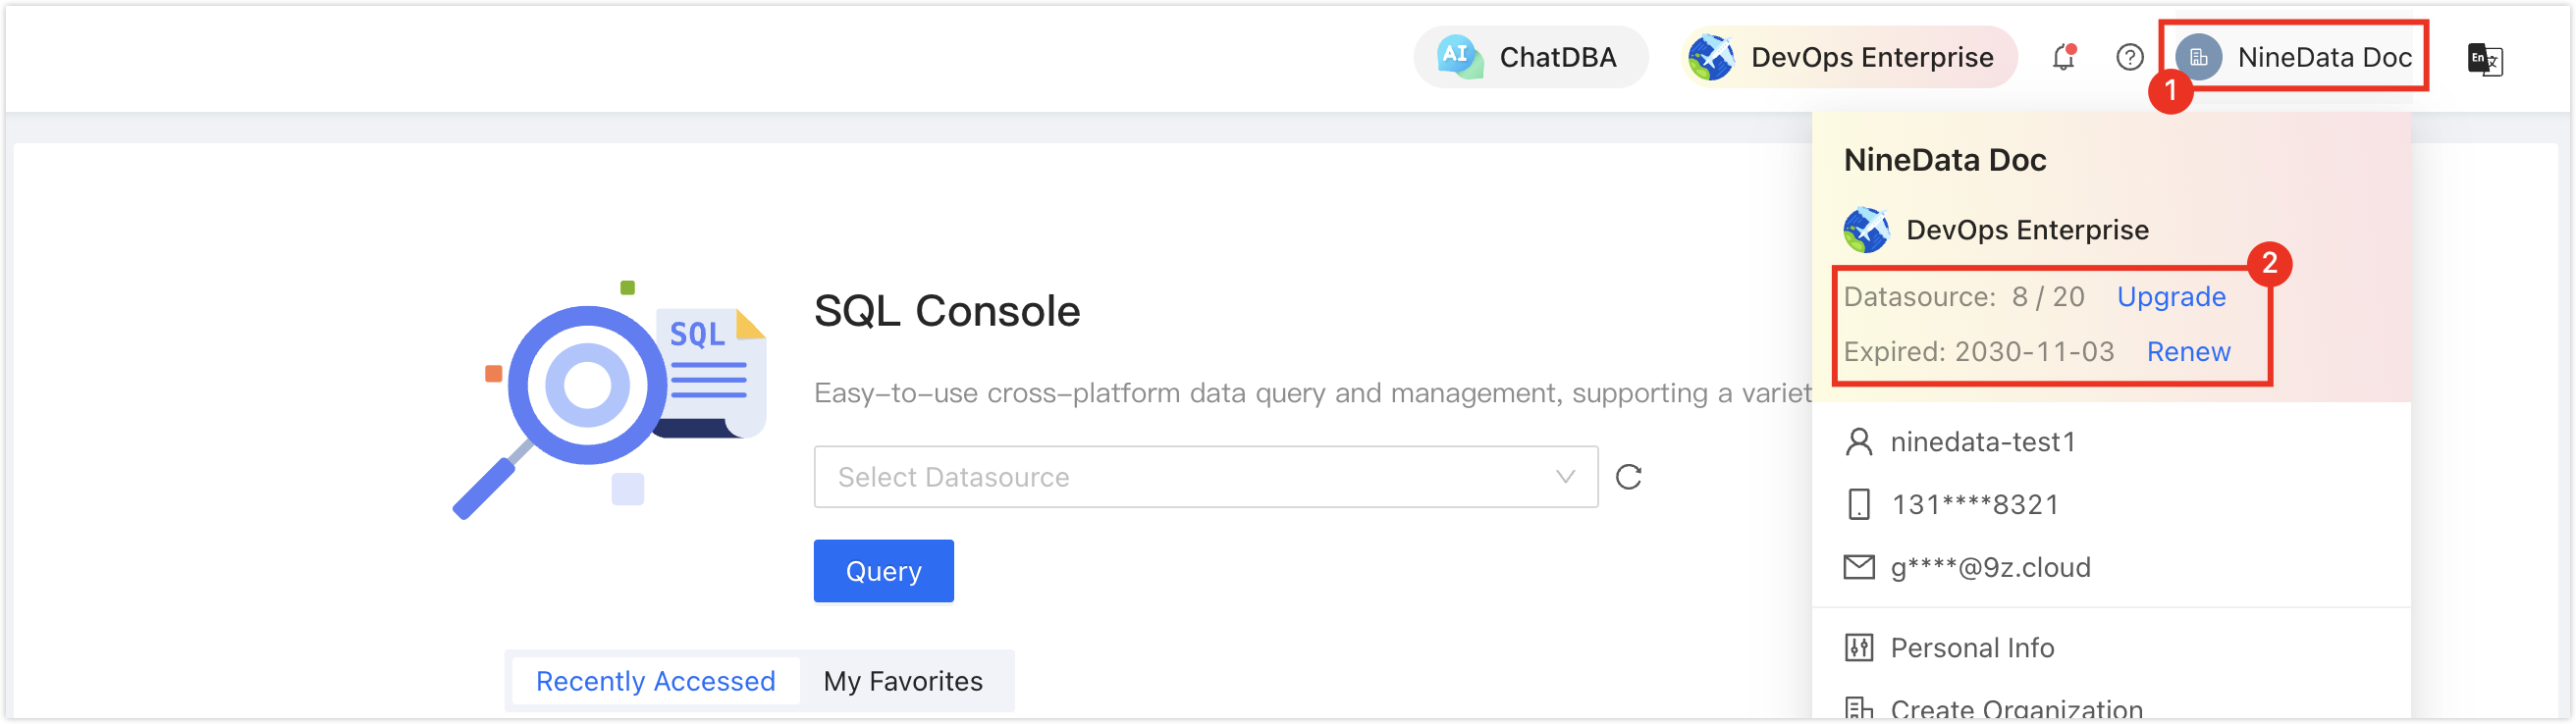
Procedure
Sign in to the NineData Console.
Go to DevOps > SQL Console.
tipIf you previously opened a data source and did not close it, NineData reopens that data source.
Select the field below SQL Console. In the data source list, select the target data source and click Query to open the SQL Console.
tip- If no Data Source exists yet, the page is empty. Click Create Datasource on the page.
- If you have multiple data sources, enter all or part of a keyword to search by these fields:
- Data source name
- IP address
After the SQL Console opens, manage the Elasticsearch data source from the interface. For details, see Interface reference.
Result
The SQL Console opens for the selected Elasticsearch data source. Browse indexes, execute Elasticsearch commands, and inspect execution details and JSON result sets.
Next steps
- Review Interface reference to understand each area of the SQL Console.
- Use execution history to locate previous commands and rerun them when needed.
Interface reference
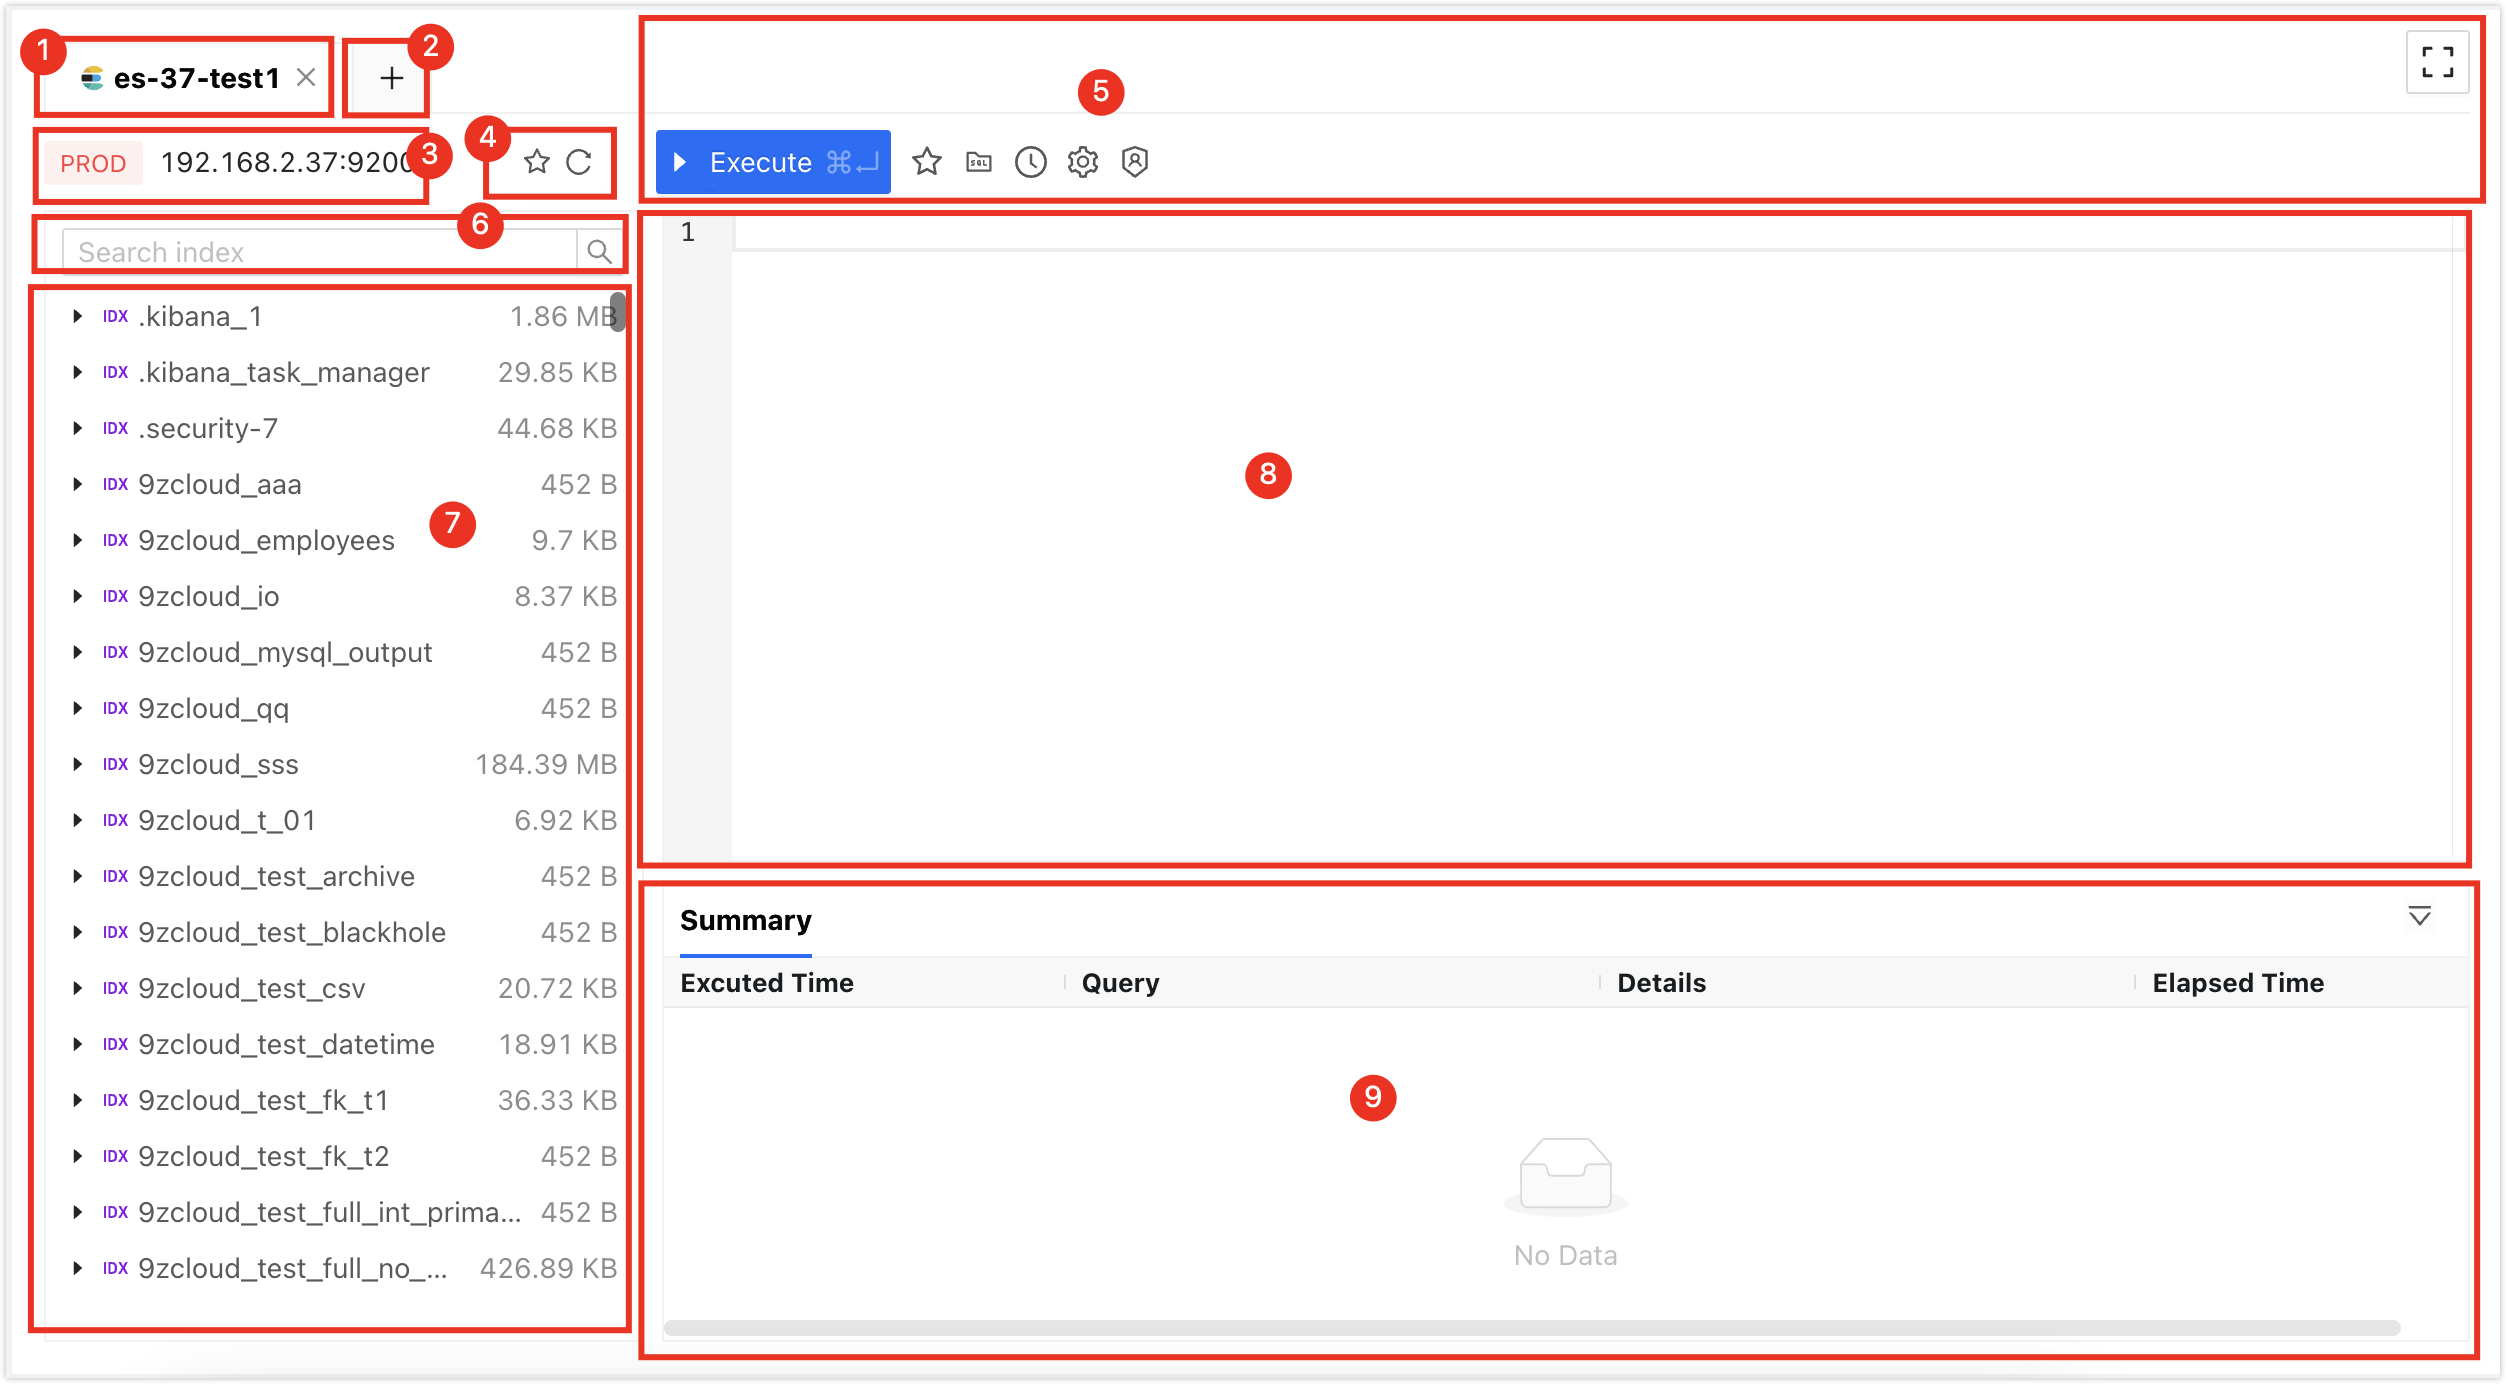
| Number | Feature | Description |
|---|---|---|
| 1 | SQL Console Tab | Represents the currently opened data source SQL Console. Use tabs to switch between SQL Consoles, and click X on a tab to close it. The right-click menu supports these actions:
|
| 2 | Open Data Source | Select and open a new data source SQL Console. |
| 3 | Data Source Information | Displays the current SQL Console data source, including environment, IP address, and port number. Right-click menu:
|
| 4 | Favorite|Refresh |
|
| 5 | Function Buttons |
|
| 6 | Search | Enter an index name to quickly access the target index. Use the complete index name for exact search, or enter partial characters for fuzzy search. |
| 8 | Index List | Displays indexes in the current Elasticsearch data source. Use this list to perform these operations:
|
| 9 | Command Line Window | Runs Elasticsearch commands. For supported command syntax, see the official documentation. The command line window supports these features:
|
| 10 | Execution Information, Result Set | Displays command execution information and results.
|
 : Execute Execute the selected Elasticsearch commands.
 : Favorite this SQL: Save all SQL statements in the current SQL Console to the SQL list for later use.
 : Favorites: View saved SQL statements. Insert the target SQL with Insert, or use Edit and Delete.
 : History: View SQL execution history for the target data source. Filter execution history by time period or search by keyword, such as SQL statement, database name, or error message.
 : Settings Set the result display mode and SQL Console font size.
 : Enable Admin Mode|Disable Admin Mode Only Administrator can use this mode. When enabled, all SQL executed in the SQL Console bypasses standardization and approval flows.
 : Full Screen Open the SQL Console in full-screen mode. In full-screen mode, click
  Exit in the toolbar to restore the original size.