SQL Console (Elasticsearch)
This article introduces how to use the SQL Console to manage an Elasticsearch database.
Background Information
Elasticsearch is an open-source distributed search and analytics engine used for fast, scalable, and real-time storage, search, and analysis of large-scale structured and unstructured data.
As a distributed system, Elasticsearch achieves high availability and horizontal scalability by storing data shards on multiple servers. It uses an inverted index data structure to support efficient full-text searching and provides rich querying and analytical capabilities.
NineData's SQL Console supports querying and operating Elasticsearch data sources in a visual and command-based manner, making Elasticsearch management more convenient and intuitive.
Feature Overview
NineData's SQL Console offers several convenient features to help you easily manage your data sources.
| Feature | Description |
|---|---|
| Visual Management | Supports accessing and viewing Elasticsearch data in a visual way. |
| Editor | Provides a command-line mode supporting powerful Elasticsearch commands and options. |
| Workspace Recovery | In scenarios like accidental browser exits or sudden crashes, you can simply log back into the NineData console, open the SQL Console, and the previously opened data sources and executed commands will be automatically loaded. Since the page state is saved in the cloud, it's not restricted by the browser or host, allowing you to recover your workspace anytime, anywhere. |
| Execution History | records all commands executed by the current account in the NineData console, supporting quick retrieval based on data source, execution time, command keywords, and more. You can also quickly copy and re-execute commands from the execution history. |
Prerequisites
The target database to be managed has been added to NineData. For instructions on how to add, refer to Managing Data Sources.
In the organizational mode (), you must have read-only, DML, or DDL permissions for the target data source.
tipRead-only permission supports query operations only.
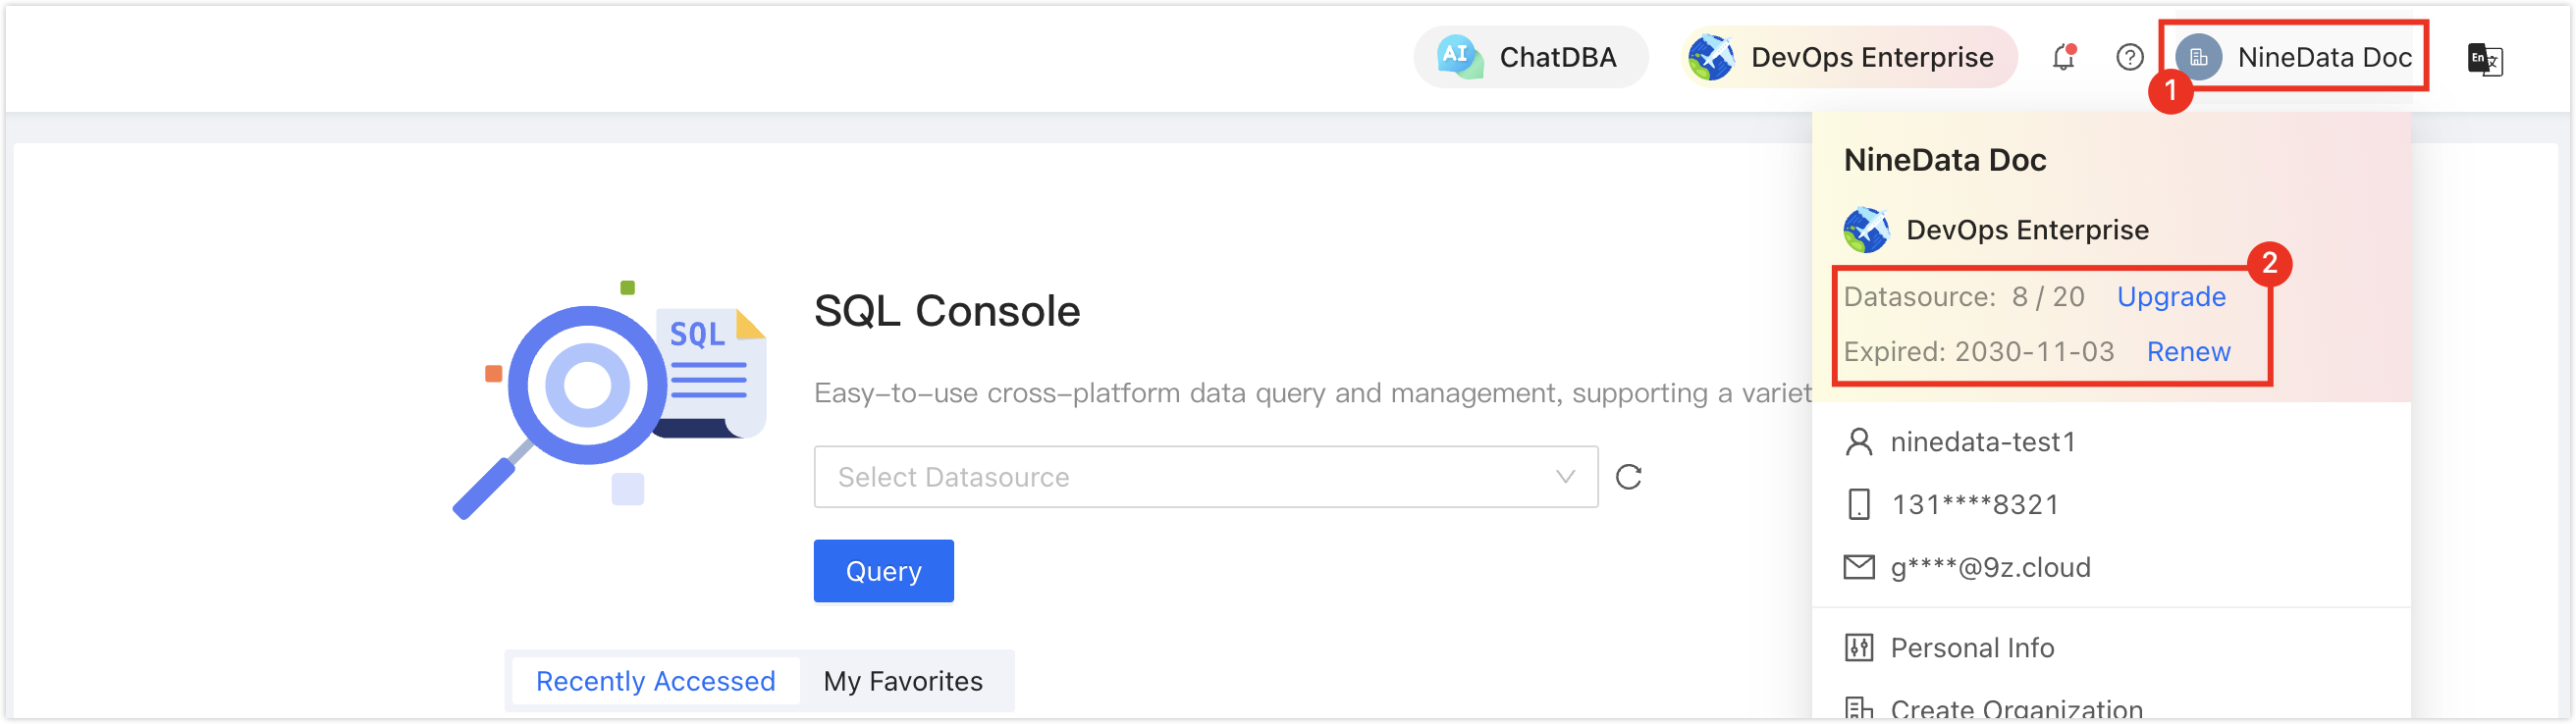
In the commercial versions (, ), please ensure that your monthly/yearly subscription is not expired, as it may result in the inability to use the Database DevOpsservice. You can quickly check the remaining quota and expiration date at the top right corner of the NineData console page.
Operating Steps
Log in to the NineData Console.
Click on and then in the left navigation menu.
tipIf you were previously logged into a data source and haven't closed it, you will automatically enter the page for that data source.
Click on the text box below , and your added data sources will pop up. Click on the target data source and then click to go to the SQL Console.
tip- If you haven't created Data Source before, a blank page will be displayed. In this case, please click on on the page.
- If you have multiple data sources, you can enter all or part of the keywords in the box for precise or fuzzy searching. Supported search fields include:
- Data source name
- IP address
After opening the SQL Console, you can perform SQL development operations on the data source. For detailed usage of the SQL Console, please refer to Interface Explanation.
Interface Explanation
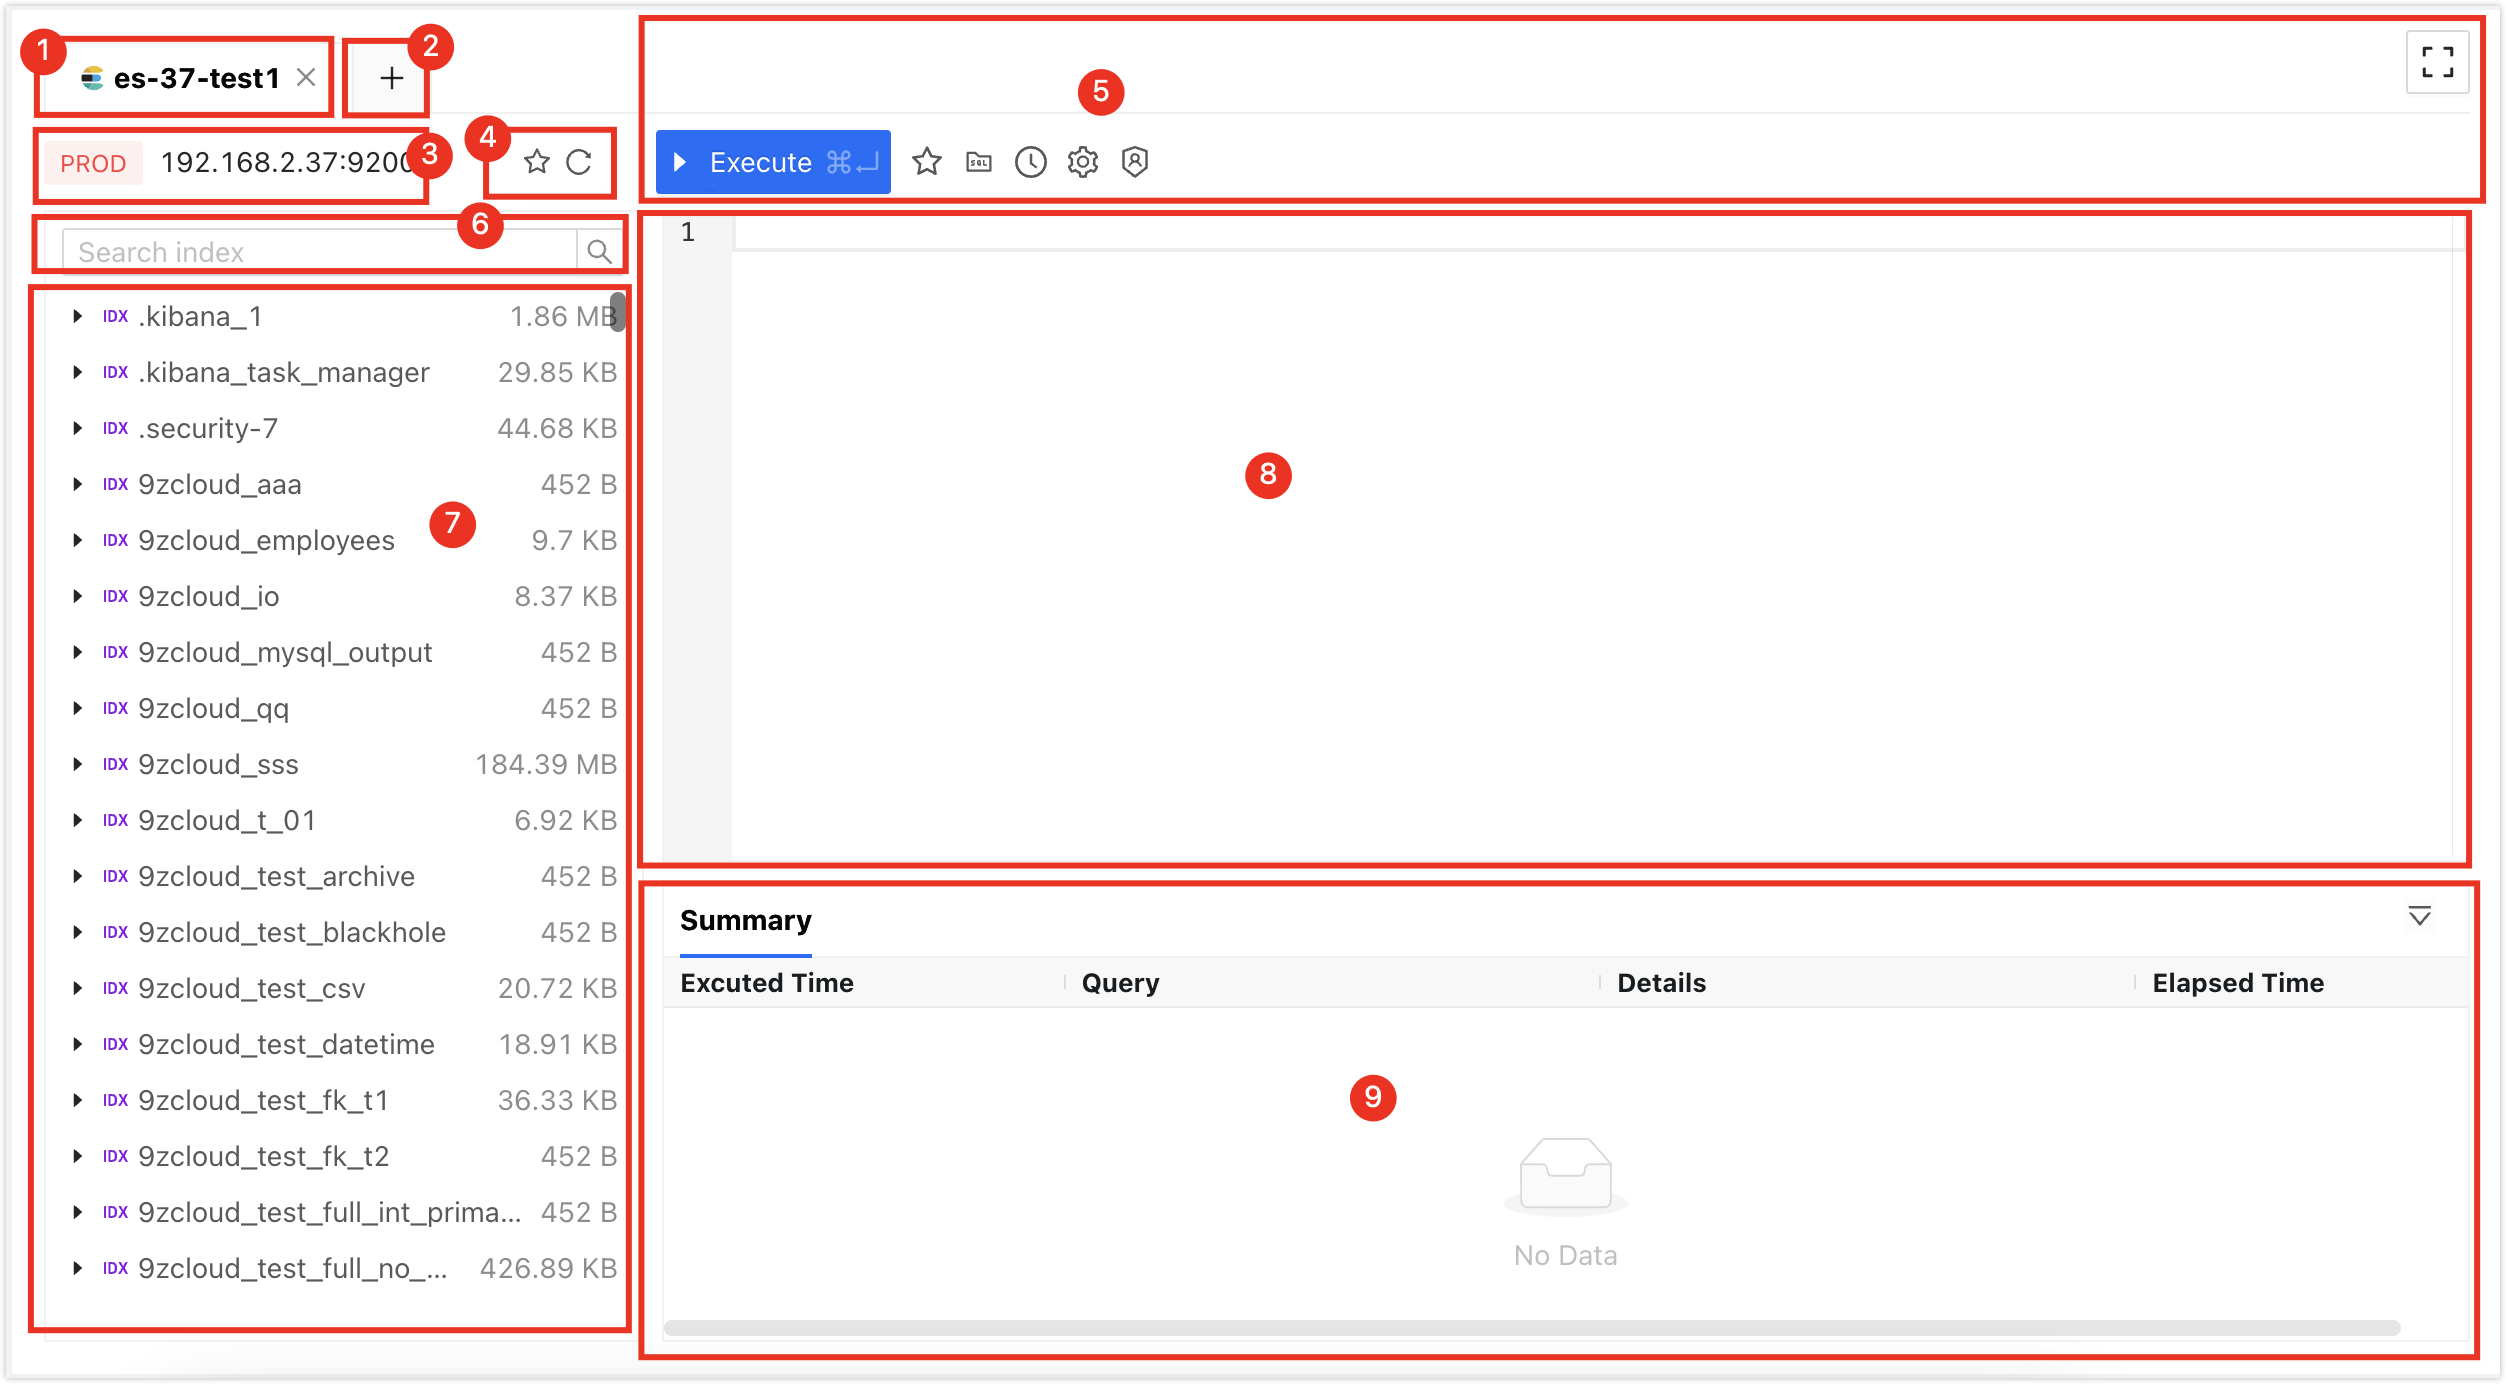
| Number | Feature | Description |
|---|---|---|
| 1 | SQL Console Tab | Represents the currently opened data source SQL Console. Multiple SQL Consoles can be switched by clicking the tabs, and clicking the X on the right of a tab can close that SQL Console. Right-click menu supports the following actions:
|
| 2 | Open Data Source | Select and open a new data source SQL Console. |
| 3 | Data Source Information | Displays information about the current SQL Console's data source, including environment, IP address, and port number. Right-click menu:
|
| 4 | Favorite|Refresh |
|
| 5 | Function Buttons |
|
| 6 | Search | Enter the index name for quick access to the target index. Supports entering the complete index name for precise search or entering partial characters for fuzzy search. |
| 8 | Index List | Displays the indexes in the current Elasticsearch. In the list, you can perform the following operations on indexes:
|
| 9 | Command Line Window | Window for executing Elasticsearch commands. Specific supported commands can be found in the official documentation. The command line window supports the following features:
|
| 10 | Execution Information, Result Set | Displays the execution information of the command and the result set.
|